Fig. 5
Download original image
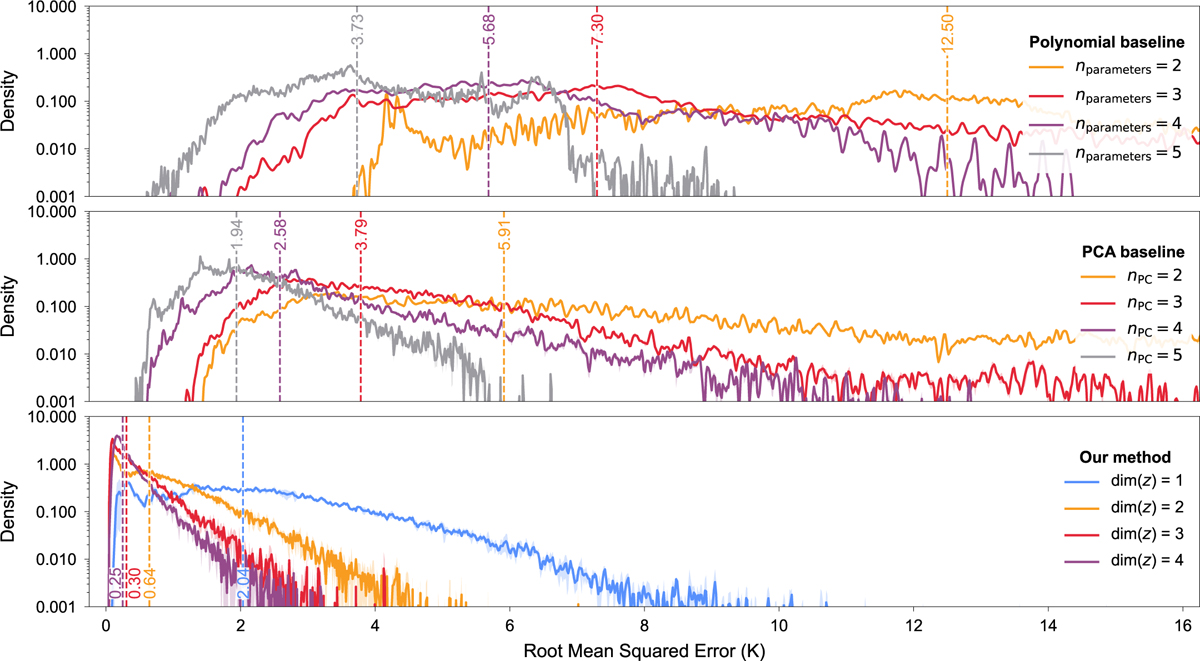
Distributions of the reconstruction error (RMSE) for a polynomial baseline, a PCA-based baseline, and our method, for different number of fitting parameters. For our model, as well as the PCA baseline, each distribution is the average of three runs using different random seeds controlling the initialization and the train/validation split. The dashed lines indicate the respective medians. Results are shown for the PYATMOS dataset; additional plots for the GOYAL-2020 are found in Fig. D.2 (https://github.com/timothygebhard/ml4ptp/blob/main/scripts/plotting/fig-5-error-distributions/plot-error-distributions.py).
Current usage metrics show cumulative count of Article Views (full-text article views including HTML views, PDF and ePub downloads, according to the available data) and Abstracts Views on Vision4Press platform.
Data correspond to usage on the plateform after 2015. The current usage metrics is available 48-96 hours after online publication and is updated daily on week days.
Initial download of the metrics may take a while.