Fig. C.1
Download original image
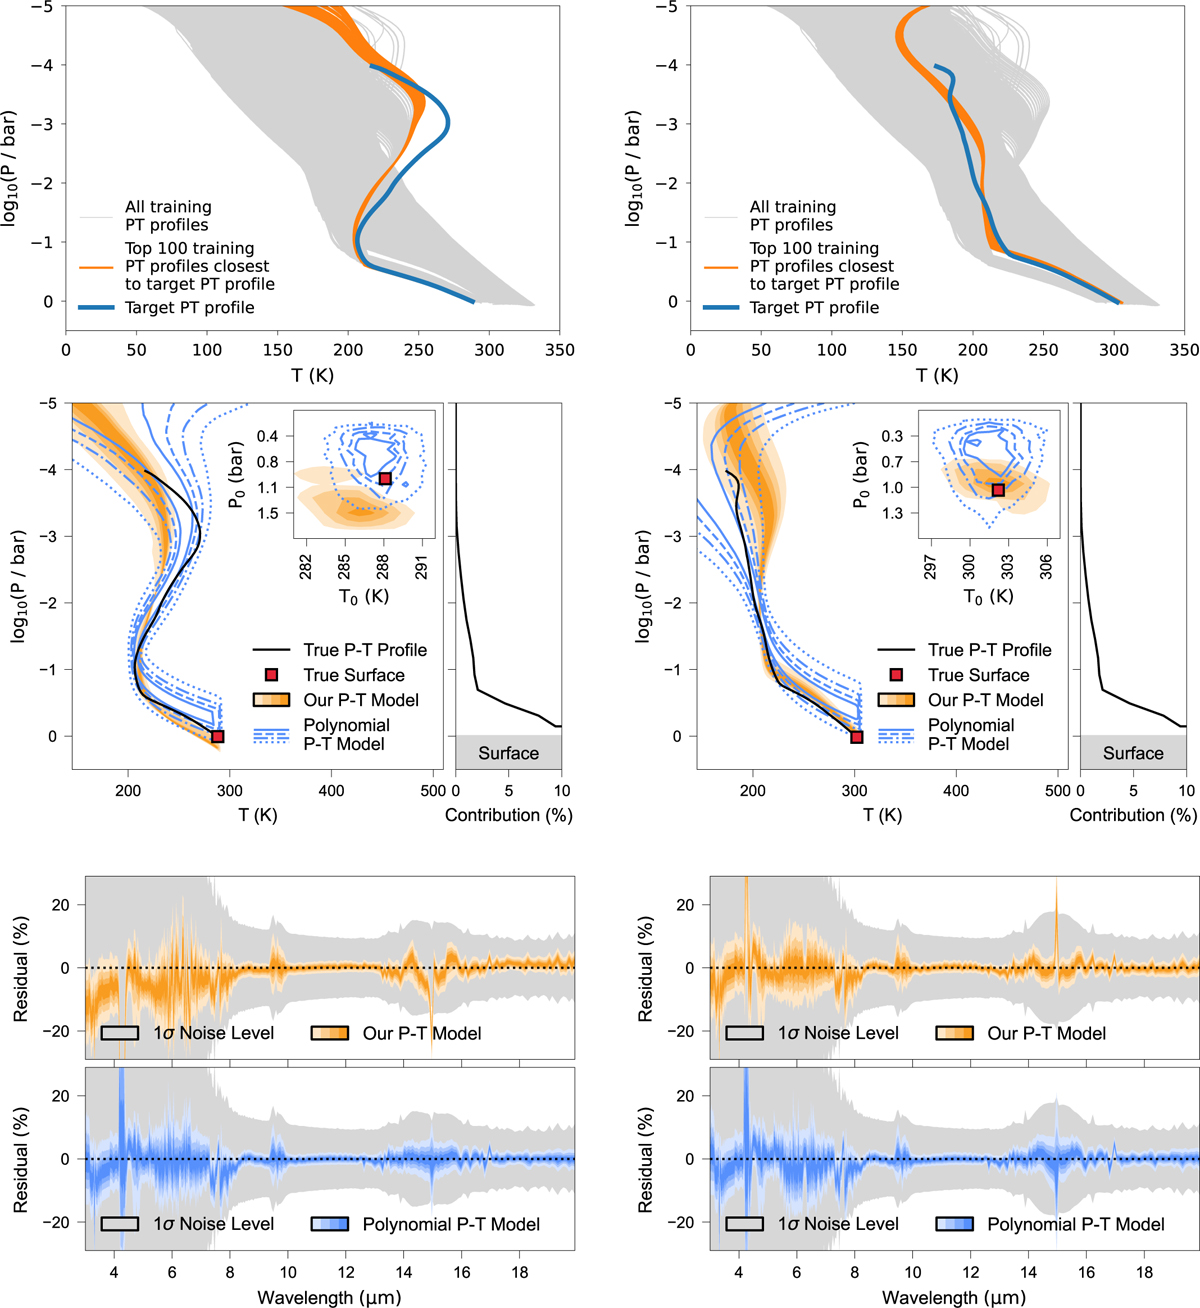
Retrieval results for both the Modern Earth and the NOE Earth case. The top panel in each subfigure shows the respective target PT profile together with the 100 best-matching PT profiles from the training set. (“Best-matching” here refers to the unweighted mean squared difference between the PT profiles, where the average is taken over all atmospheric layers.) The middle panel shows the PT profiles obtained by our simulated atmospheric retrieval, both for our model and for the polynomial baseline. Finally, the bottom panel shows the respective fitting errors on the spectrum; cf. the right side of Fig. 9.
Current usage metrics show cumulative count of Article Views (full-text article views including HTML views, PDF and ePub downloads, according to the available data) and Abstracts Views on Vision4Press platform.
Data correspond to usage on the plateform after 2015. The current usage metrics is available 48-96 hours after online publication and is updated daily on week days.
Initial download of the metrics may take a while.