Fig. 2
Download original image
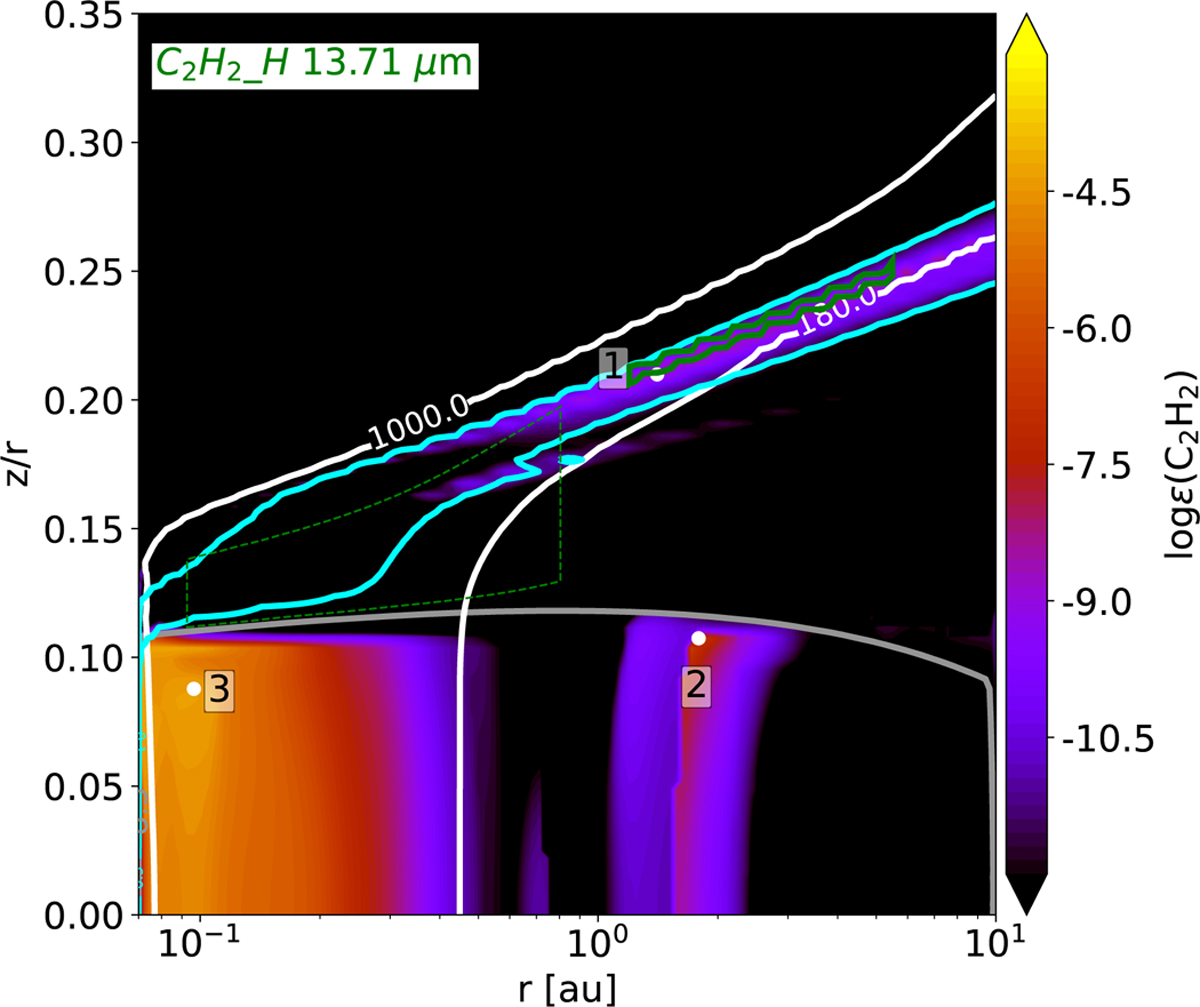
Abundance of C2H2 with respect to n〈H〉 obtained from the fiducial disk model. The white lines show the gas temperature contours for 180 K and 1000 K The gray contour depicts AV = 8.5. The green dotted line shows the region from which 50% of the continuum emits at ~13.7 µm (representative of the v5 fundamental band). The green solid line shows the region where 50% of the flux is emitted by C2H2 at 13.7 µm. The white dots indicate the grid points for which the chemistry is subsequently analysed in detail. The cyan contours depict where 20 and 99% of hydrogen is in the form of H2.
Current usage metrics show cumulative count of Article Views (full-text article views including HTML views, PDF and ePub downloads, according to the available data) and Abstracts Views on Vision4Press platform.
Data correspond to usage on the plateform after 2015. The current usage metrics is available 48-96 hours after online publication and is updated daily on week days.
Initial download of the metrics may take a while.