Fig. 2
Download original image
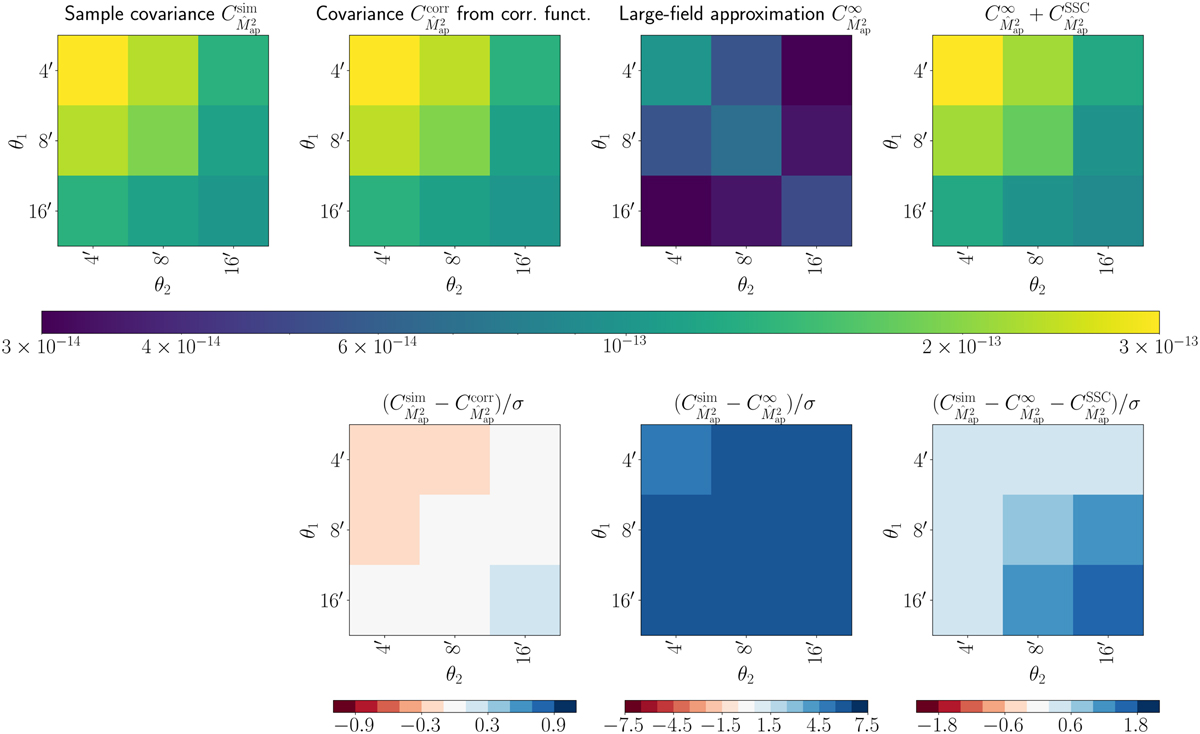
Comparison of ![]() covariance obtained in different ways. Upper row, from left to right: sample covariance from the SLICS, covariance estimated from Map correlation functions in the SLICS, model covariance under the large-field approximation, full model covariance including the finite field terms. Lower row: differences between sample covariance and other covariance estimates, normalised by bootstrap uncertainty of the sample covariance. We note that the colour bar changes between the three bottom plots.
covariance obtained in different ways. Upper row, from left to right: sample covariance from the SLICS, covariance estimated from Map correlation functions in the SLICS, model covariance under the large-field approximation, full model covariance including the finite field terms. Lower row: differences between sample covariance and other covariance estimates, normalised by bootstrap uncertainty of the sample covariance. We note that the colour bar changes between the three bottom plots.
Current usage metrics show cumulative count of Article Views (full-text article views including HTML views, PDF and ePub downloads, according to the available data) and Abstracts Views on Vision4Press platform.
Data correspond to usage on the plateform after 2015. The current usage metrics is available 48-96 hours after online publication and is updated daily on week days.
Initial download of the metrics may take a while.