Fig. 7.
Download original image
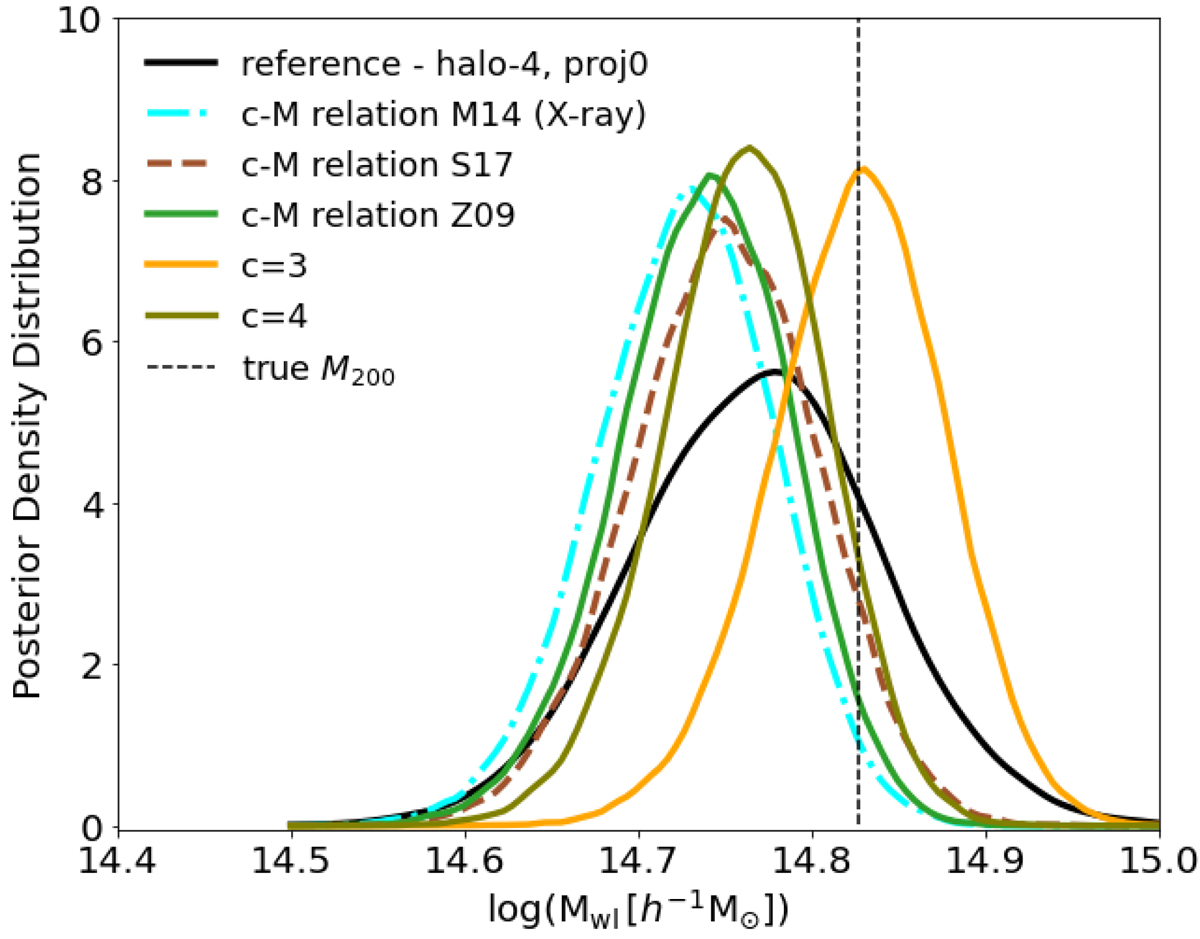
Posterior distributions when the logarithm of the cluster mass is recovered for proj0 of halo-4 at z = 0.22. The black curve shows the reference case, where we model both the mass and the concentration, as in the top panel of Fig. 5. The other histograms show the posteriors when a parametrisation of the concentration-mass relation is assumed; in particular, the orange and olive curves refer to the cases with a constant value of c200 = 3 and c200 = 4, respectively. The vertical dashed black line marks the true value of M200 as computed by AHF.
Current usage metrics show cumulative count of Article Views (full-text article views including HTML views, PDF and ePub downloads, according to the available data) and Abstracts Views on Vision4Press platform.
Data correspond to usage on the plateform after 2015. The current usage metrics is available 48-96 hours after online publication and is updated daily on week days.
Initial download of the metrics may take a while.