Fig. 11.
Download original image
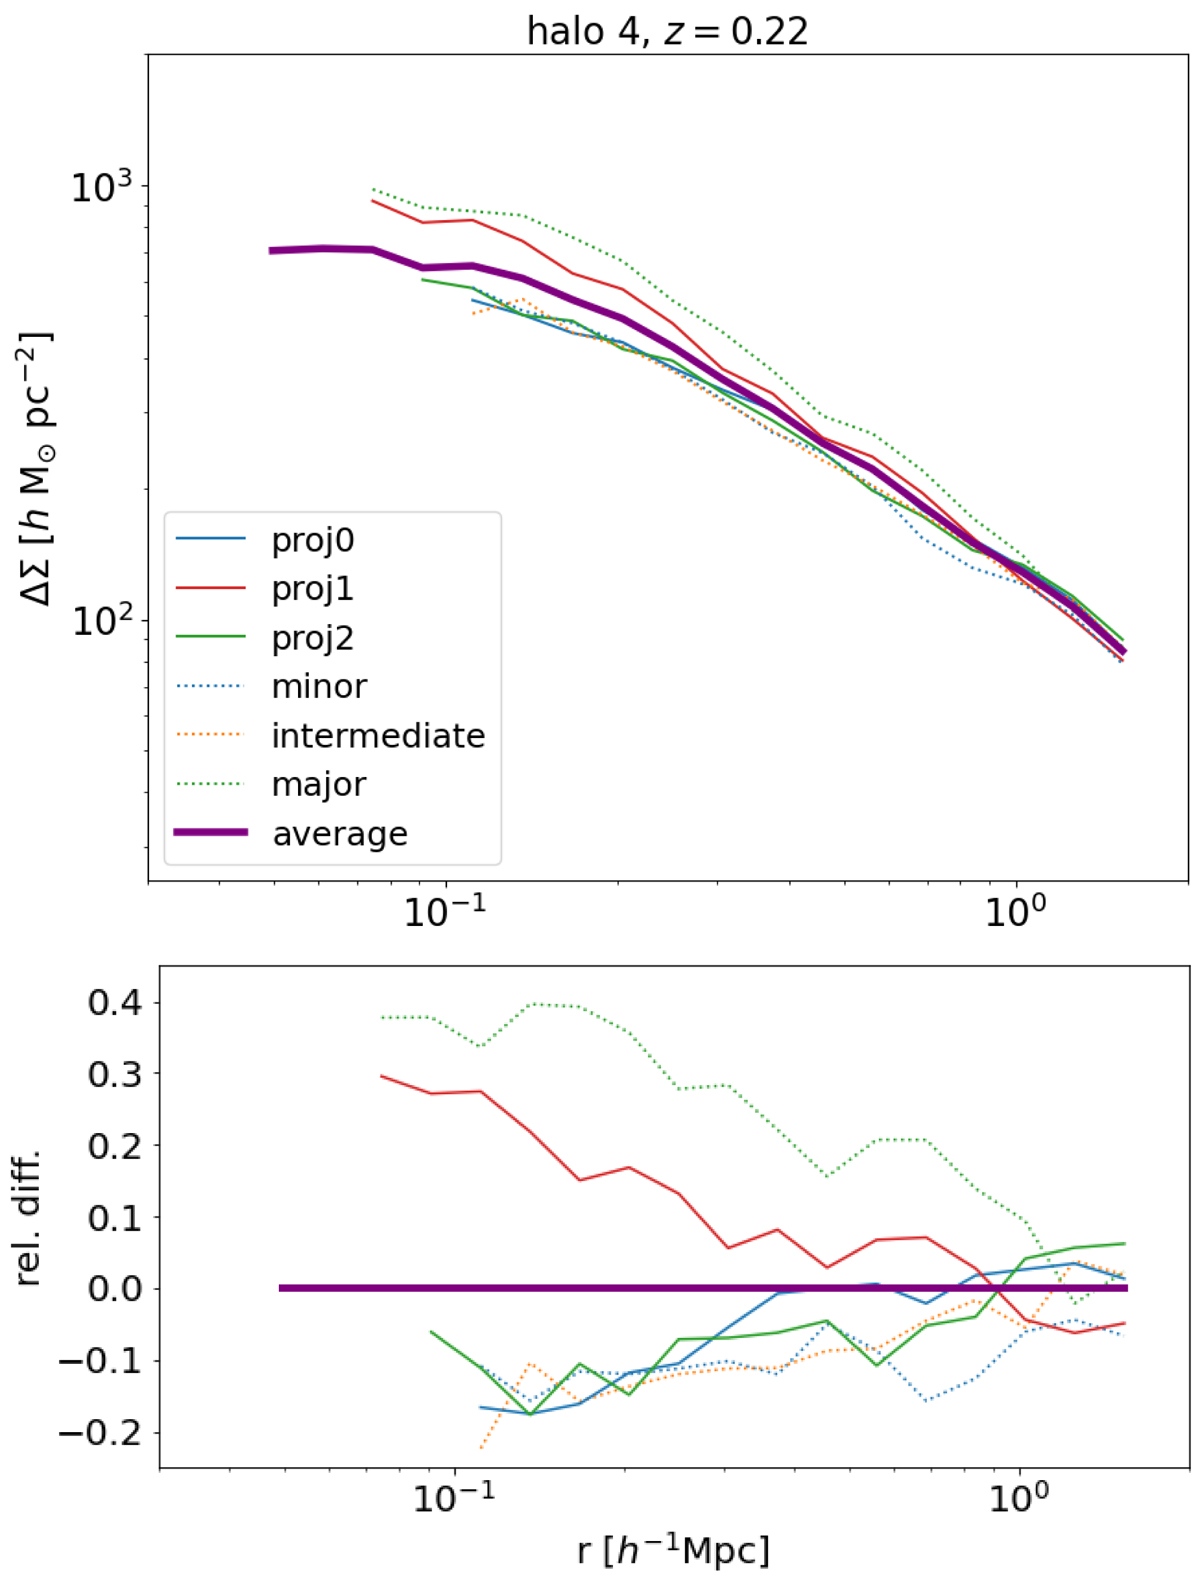
Top panel: average excess surface mass density profile averaging six different projections of the same cluster (halo-4 at z = 0.22): three randoms and three preferentials. For comparison, the solid blue, red, and green curves show the individual profiles around the three random projections, and the dashed blue, orange, and green lines show the cluster oriented along the minor, intermediate, and major axis of the moment of inertia tensor ellipsoid. Bottom panel: relative difference of the individual profiles with respect to the averaged one.
Current usage metrics show cumulative count of Article Views (full-text article views including HTML views, PDF and ePub downloads, according to the available data) and Abstracts Views on Vision4Press platform.
Data correspond to usage on the plateform after 2015. The current usage metrics is available 48-96 hours after online publication and is updated daily on week days.
Initial download of the metrics may take a while.