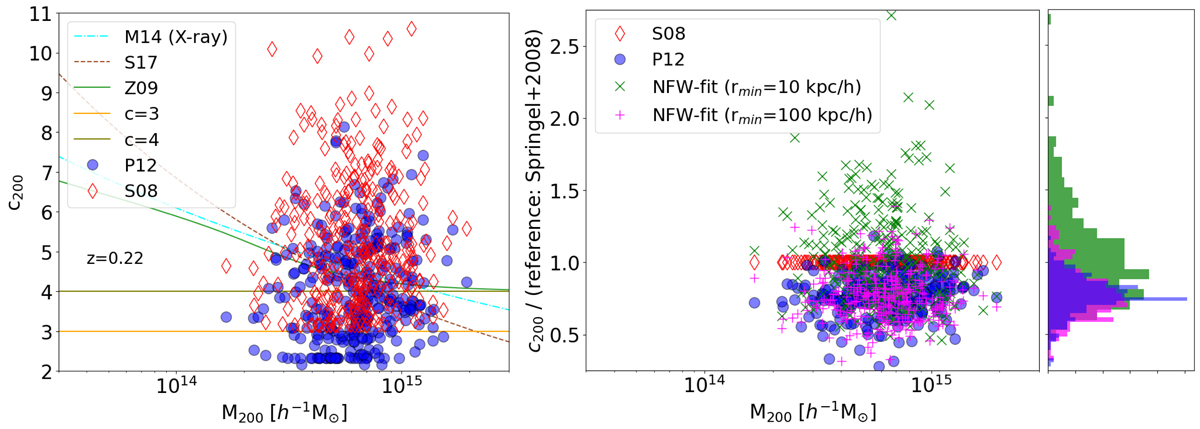
Fig. 1.
Download original image
Left panel: concentration-mass relation of the clusters at z = 0.22. The blue and red data points represent the concentration values computed using the P12 and S08 relations, respectively. The various lines display different concentration-mass relation models computed at z = 0.22. Right panel: ratio of the measured concentration, using different methods compared with respect to the Springel et al. (2008b) formalism. The green crosses and magenta pluses display the case in which we compute the concentration by fitting the differential logarithmic density profile outside 10 and 100 h−1 kpc, respectively.
Current usage metrics show cumulative count of Article Views (full-text article views including HTML views, PDF and ePub downloads, according to the available data) and Abstracts Views on Vision4Press platform.
Data correspond to usage on the plateform after 2015. The current usage metrics is available 48-96 hours after online publication and is updated daily on week days.
Initial download of the metrics may take a while.