Open Access
Fig. 7.
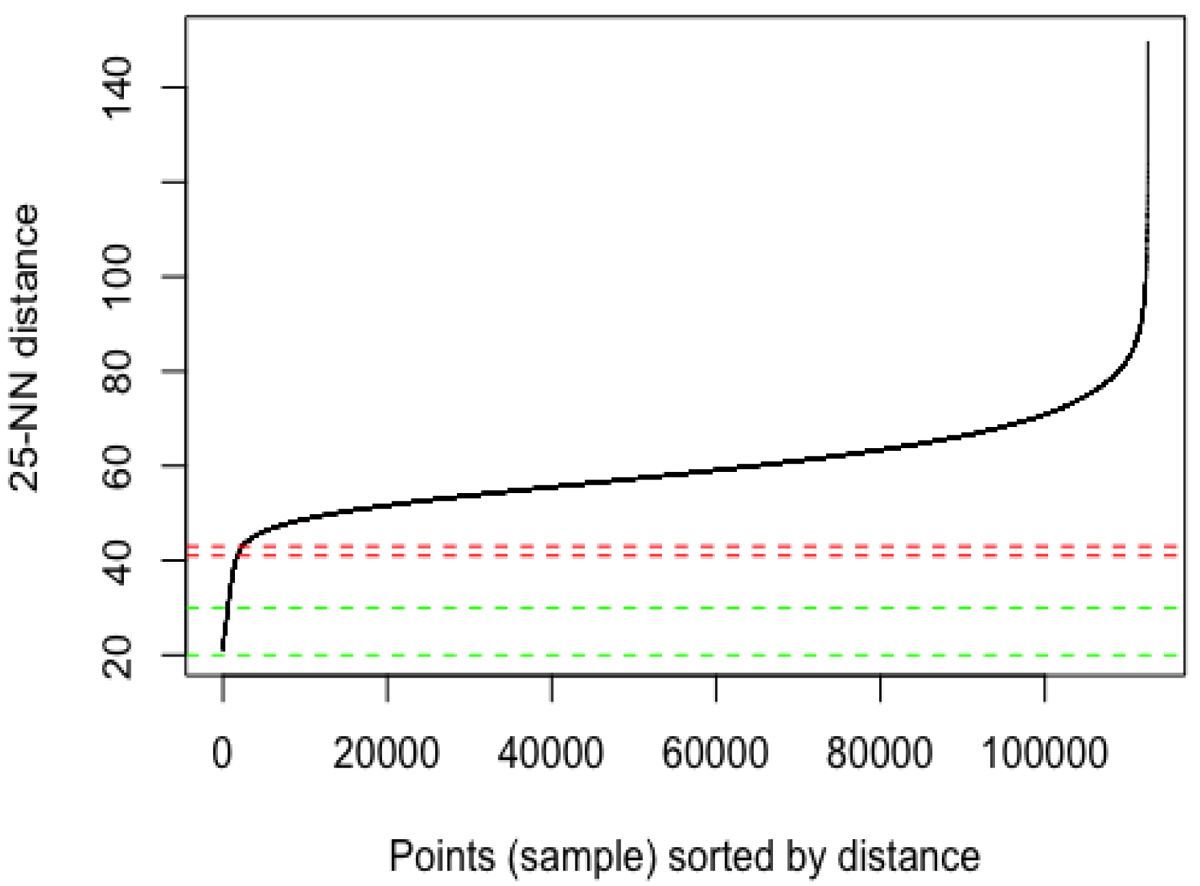
Download original image
kNN distance plot for field SMC5 (k = MinPts = 25). The two red lines denote the start of the knee formation. The blue line denotes the start of the curve, and the two green lines are placed in the middle between the starting line and the knee formation. The distances are plotted in pixels.
Current usage metrics show cumulative count of Article Views (full-text article views including HTML views, PDF and ePub downloads, according to the available data) and Abstracts Views on Vision4Press platform.
Data correspond to usage on the plateform after 2015. The current usage metrics is available 48-96 hours after online publication and is updated daily on week days.
Initial download of the metrics may take a while.