Open Access
Fig. 4.
Download original image
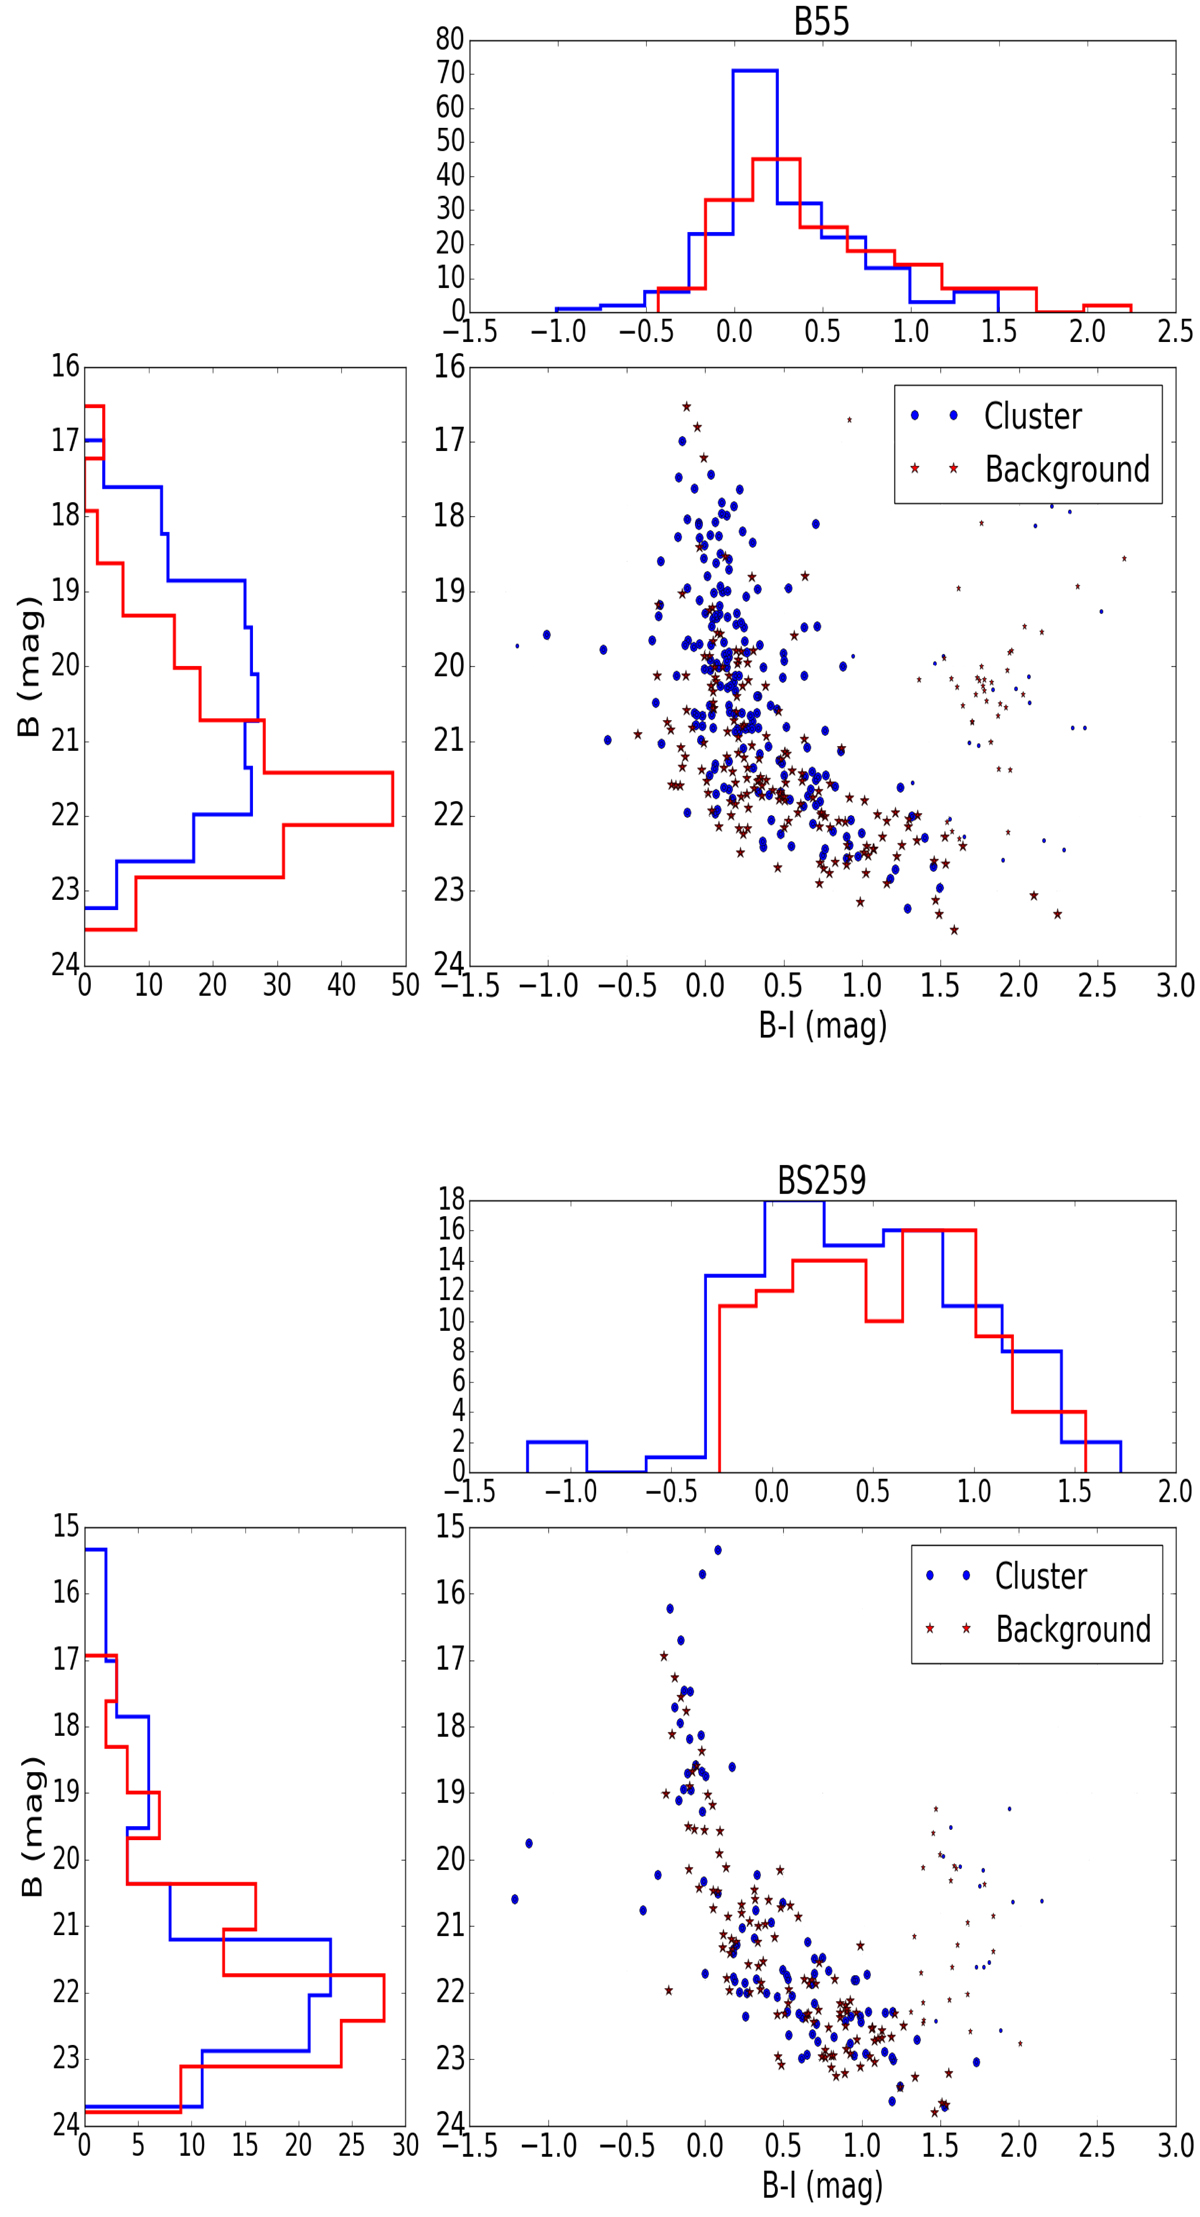
CMDs and magnitude and colour distributions of MS stars for B55 (top) and BS259 (bottom). The blue symbols and lines correspond to the cluster region, and the red symbols and lines to the neighbouring background region of equal area. On the CMD, stars selected to be on the MS are denoted with larger symbols.
Current usage metrics show cumulative count of Article Views (full-text article views including HTML views, PDF and ePub downloads, according to the available data) and Abstracts Views on Vision4Press platform.
Data correspond to usage on the plateform after 2015. The current usage metrics is available 48-96 hours after online publication and is updated daily on week days.
Initial download of the metrics may take a while.