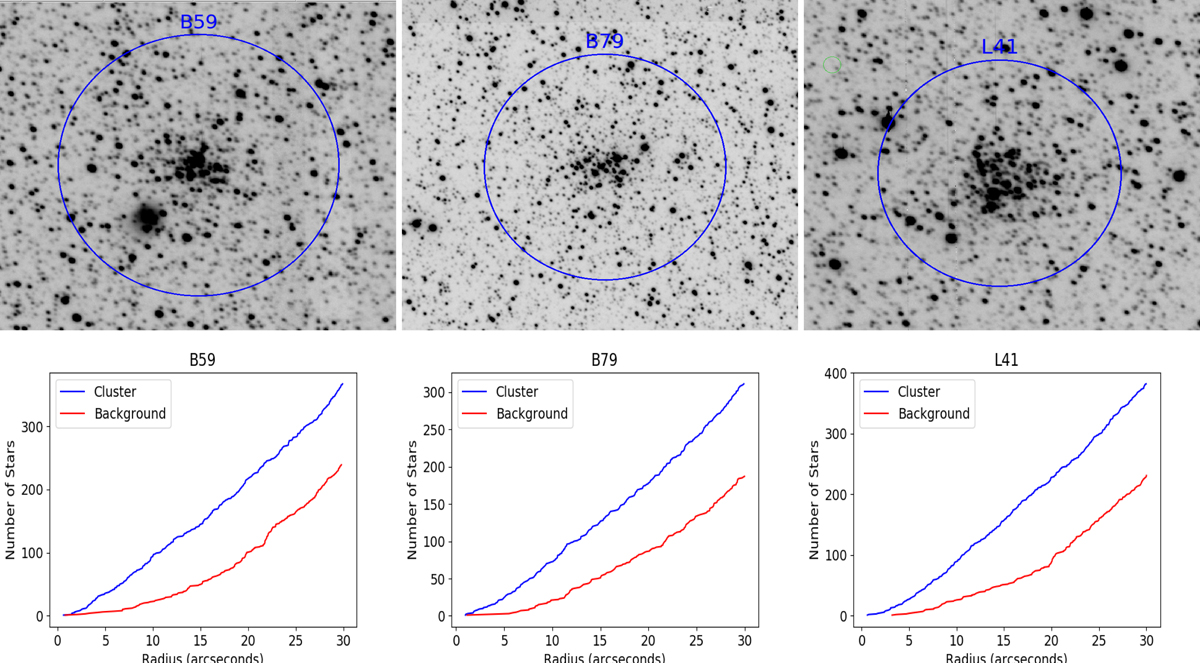
Fig. 2.
Download original image
Images and growth curves for objects of Class 3. In all cases, the growth curves for the clusters (shown in blue) differ significantly from the growth curve for a uniform distribution (shown in red). The cluster radius as provided by the reference catalogue is indicated with a blue circle. B-band IMACS images are presented in the top panels and growth curves in the bottom panels for objects B59, B79, and L41.
Current usage metrics show cumulative count of Article Views (full-text article views including HTML views, PDF and ePub downloads, according to the available data) and Abstracts Views on Vision4Press platform.
Data correspond to usage on the plateform after 2015. The current usage metrics is available 48-96 hours after online publication and is updated daily on week days.
Initial download of the metrics may take a while.