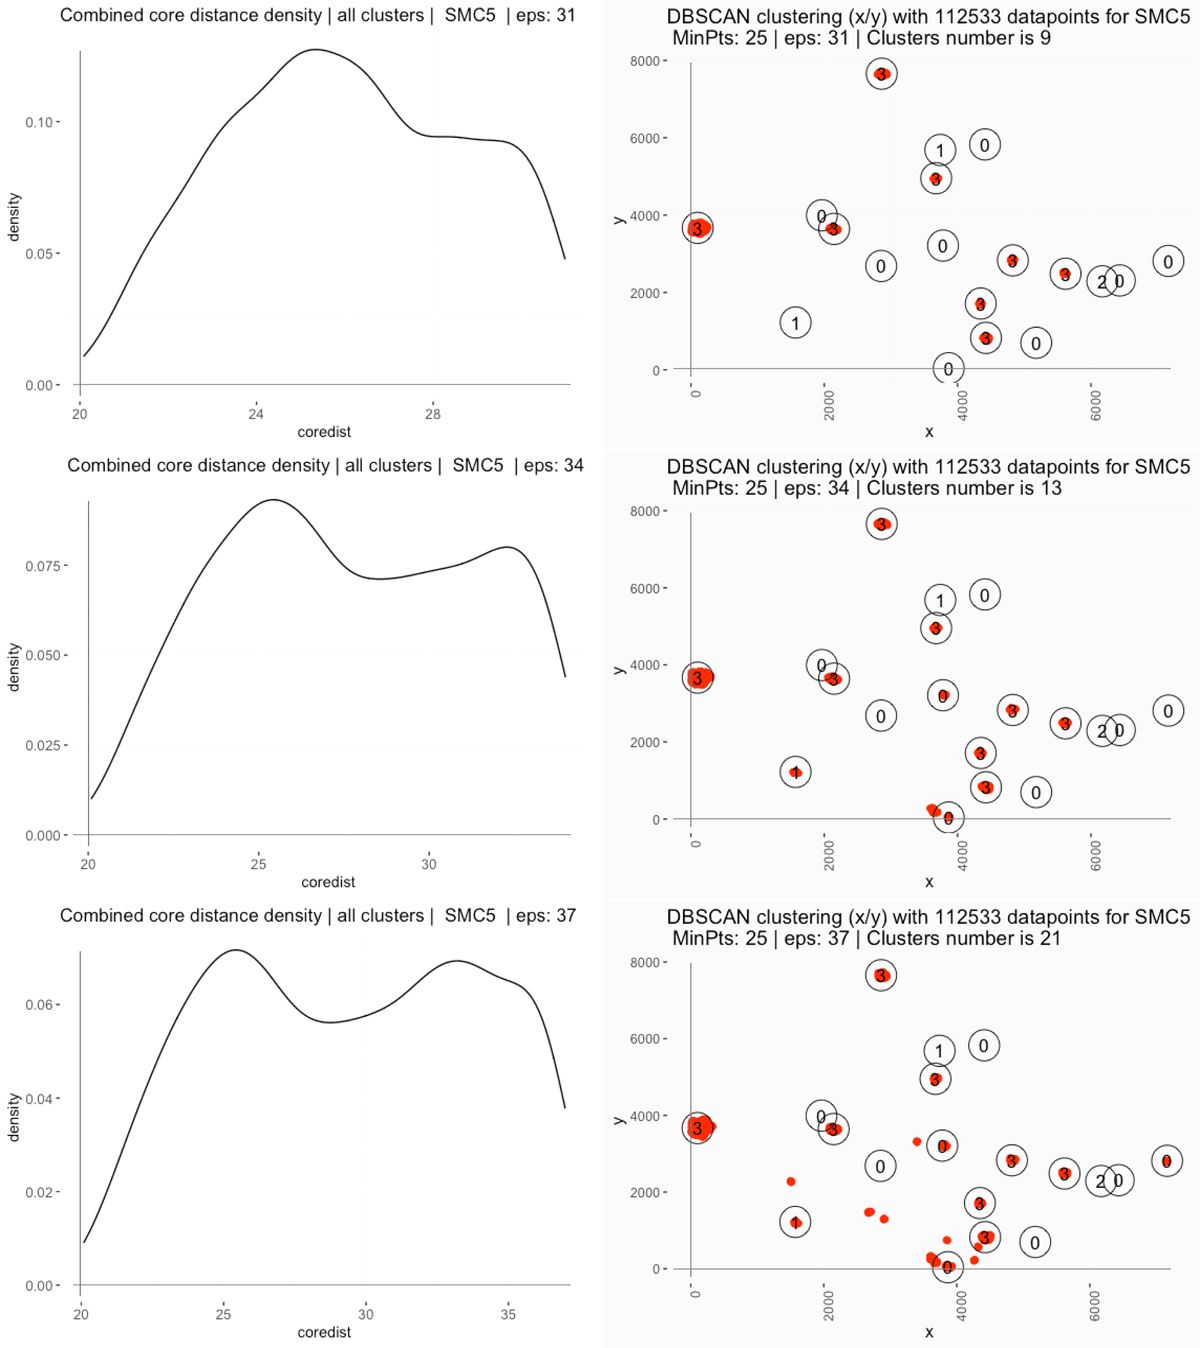
Fig. 10.
Download original image
Combined core distance-density plots for all candidate clusters detected by DBSCAN for different eps values (31, 34, and 37) (left) and the positions and shapes of the detected DBSCAN clusters, shown in red, for the corresponding eps values (right). X and Y are pixel positions in the IMACS dataset for field SMC5 (used here as an example). The numbers 0, 1, 2, and 3 shown in circles denote the Class of the actual cluster (if there is one) as determined with the diagnostics of Sect. 3. The extended cluster near the left edge of the maps corresponds to two nearby clusters as detected from DBSCAN with MinPts = 25. This explains the discrepancy when we meticulously count the red clusters and compare them with the cluster count in the title of the plot.
Current usage metrics show cumulative count of Article Views (full-text article views including HTML views, PDF and ePub downloads, according to the available data) and Abstracts Views on Vision4Press platform.
Data correspond to usage on the plateform after 2015. The current usage metrics is available 48-96 hours after online publication and is updated daily on week days.
Initial download of the metrics may take a while.