Fig. 2.
Download original image
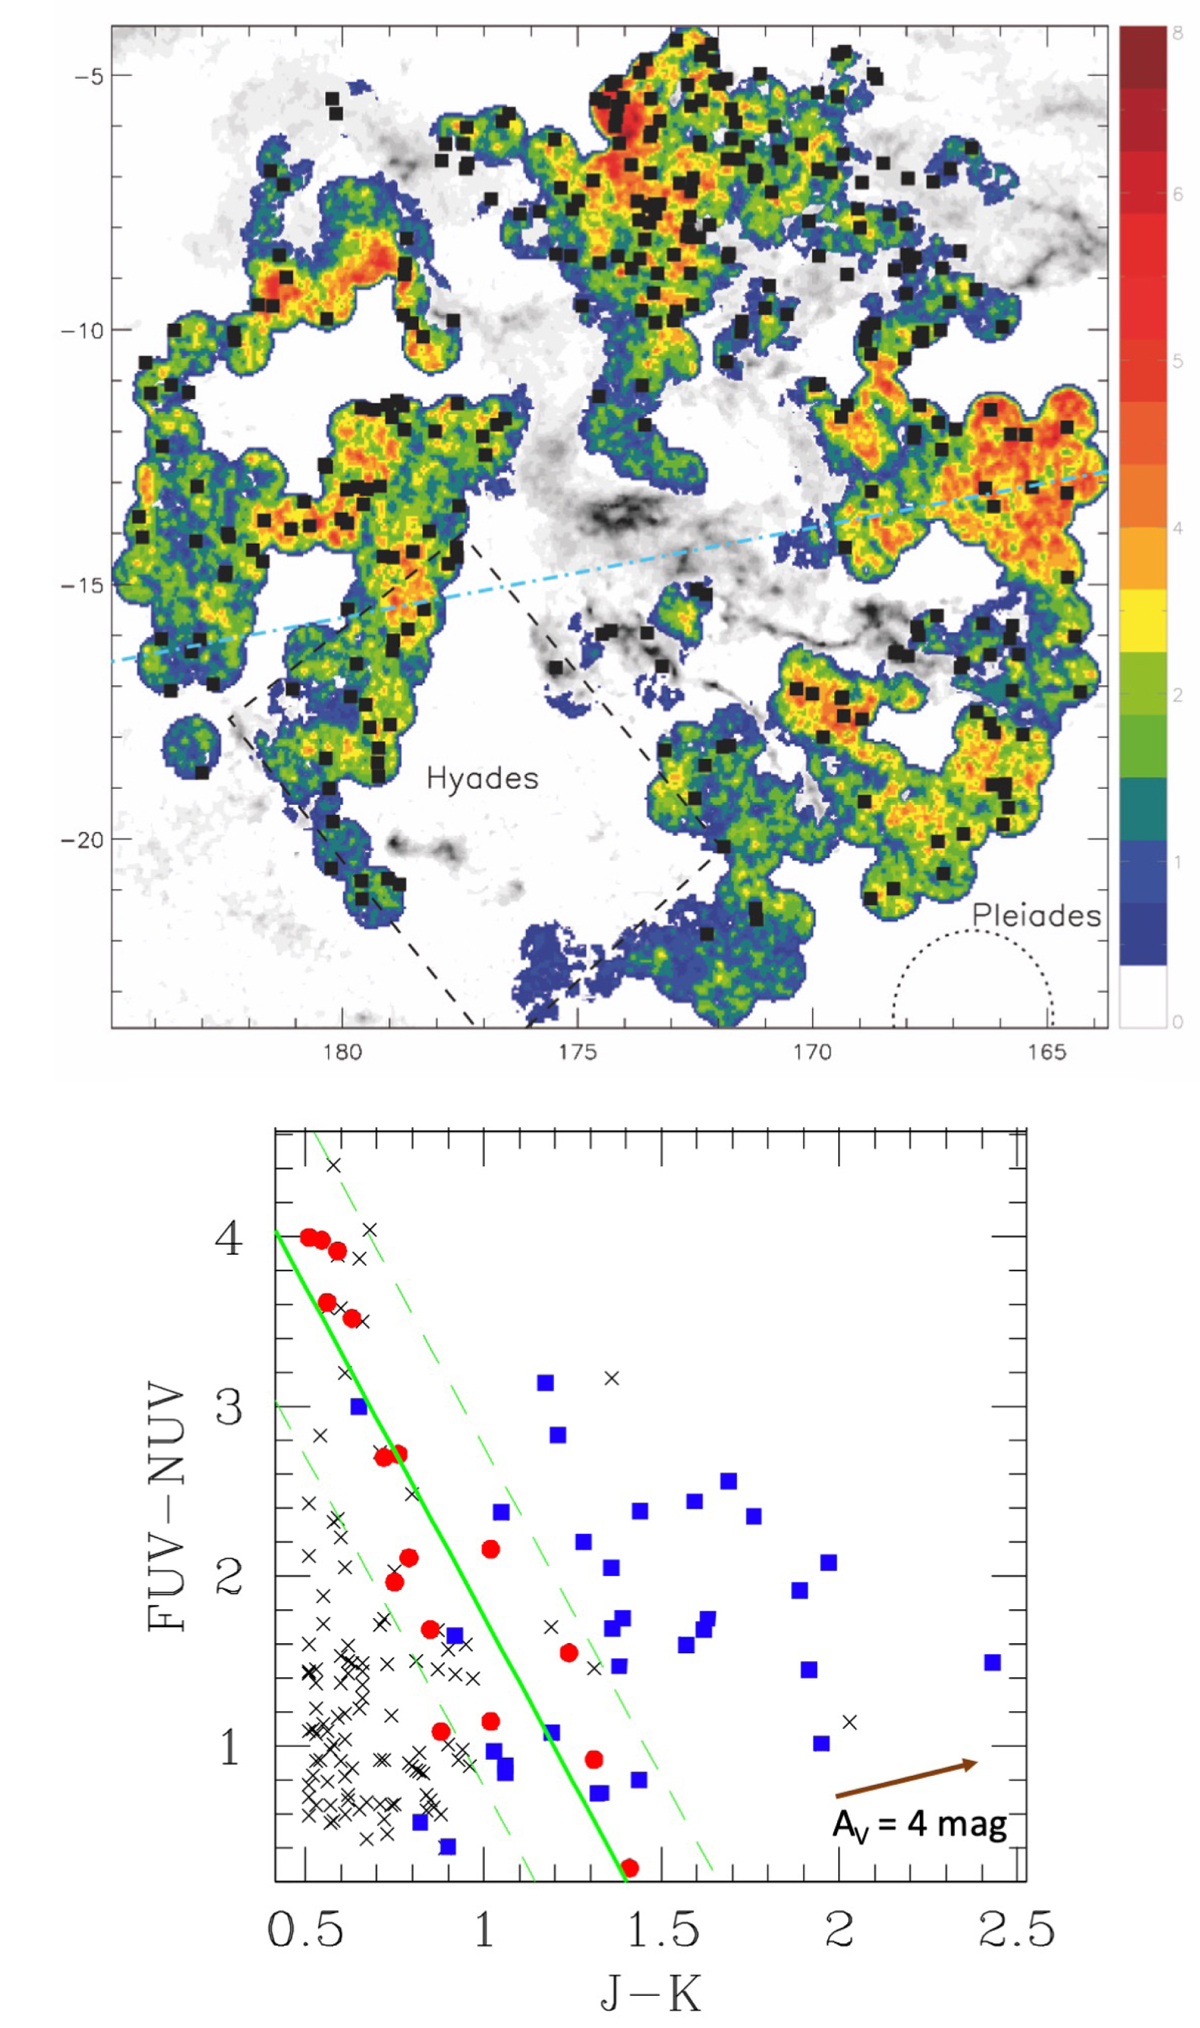
Candidate TTSs in the TAMC from GdC2015. Top panel: location of the TTSs and candidates on the sky overlaid on the density of GALEX NUV sources, in galactic coordinates; stellar densities are color coded. The density of molecular gas is outlined from the 2MASS extinction map by Lombardi et al. (2010). Bottom panel: color–color diagram used for the selection of the TTSs candidates in GdC2015. Candidates are marked with black crosses, and known CTTSs and WTTSs from the qualification sample are represented by blue squares and red circles, respectively. The regression line marking the location of the WTTSs in the diagram is plotted (solid green line) as well as the uncertainty band from the fit (dashed green lines); most of the TTS candidates to be analyzed in this work are within this strip.
Current usage metrics show cumulative count of Article Views (full-text article views including HTML views, PDF and ePub downloads, according to the available data) and Abstracts Views on Vision4Press platform.
Data correspond to usage on the plateform after 2015. The current usage metrics is available 48-96 hours after online publication and is updated daily on week days.
Initial download of the metrics may take a while.