Open Access
Fig. B.1.
Download original image
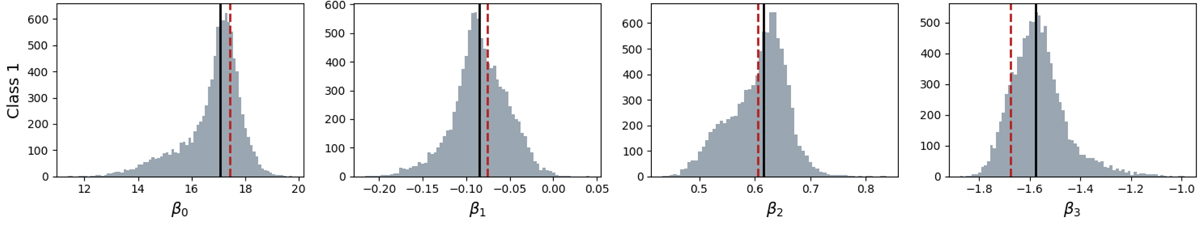
Final distributions for the logistic regression coefficients after 104 Monte Carlo realizations. The solid black line corresponds to the median value adopted as the best fit, while the red dashed line corresponds to the value obtained from the fit of the original variables without taking errors into account.
Current usage metrics show cumulative count of Article Views (full-text article views including HTML views, PDF and ePub downloads, according to the available data) and Abstracts Views on Vision4Press platform.
Data correspond to usage on the plateform after 2015. The current usage metrics is available 48-96 hours after online publication and is updated daily on week days.
Initial download of the metrics may take a while.