Fig. 8.
Download original image
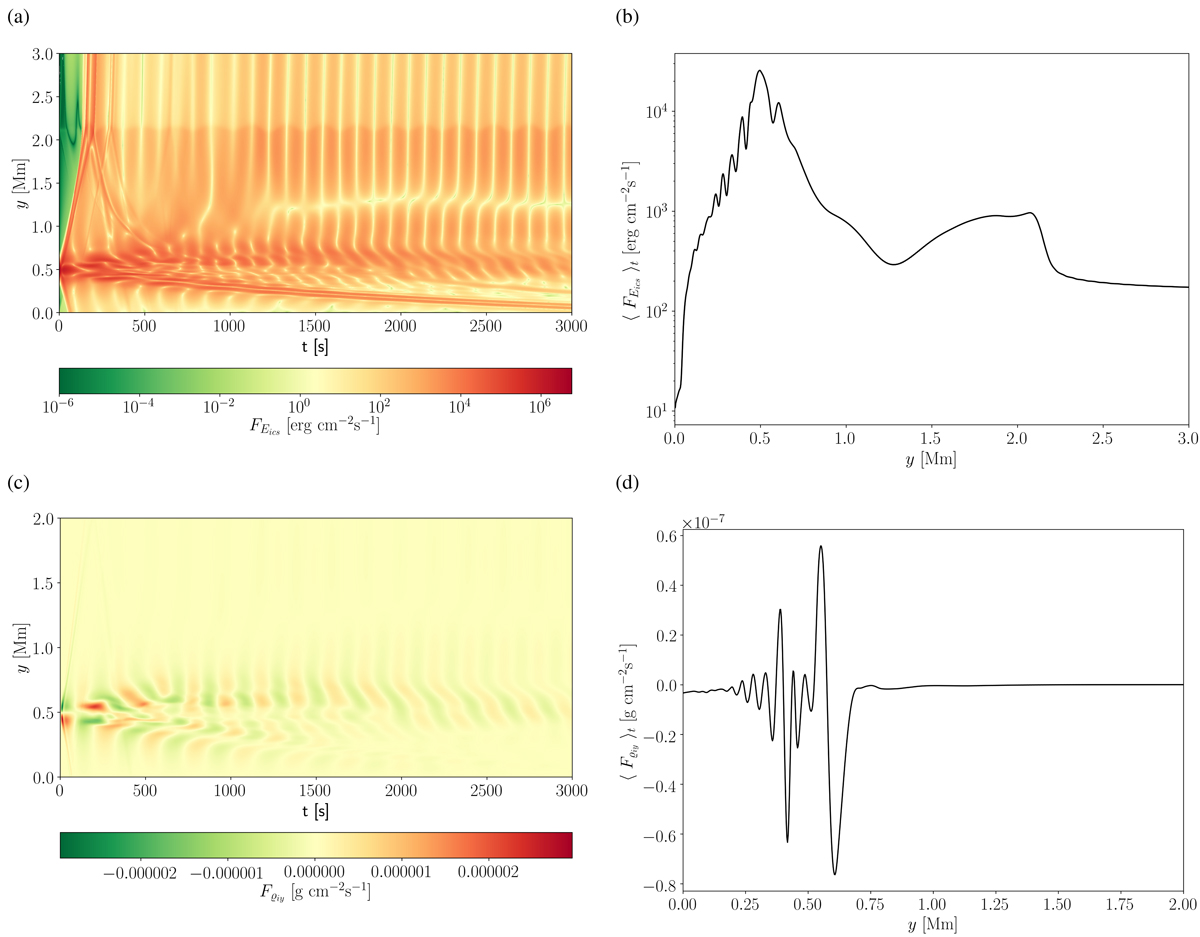
Time-distance plots for kinetic energy flux, FE(x = 0, y, t) (a), and its corresponding vertical profiles averaged over time (b). Time distance plot for total ion vertical mass density flux, Fm(x = 0, y, t) = 𝜚iViy, (c) and its corresponding vertical profiles averaged over time (d). These plots correspond to Fig. 4 and represent the variations of the energy flux (a, b) and mass flux (c, d) due to MAWs.
Current usage metrics show cumulative count of Article Views (full-text article views including HTML views, PDF and ePub downloads, according to the available data) and Abstracts Views on Vision4Press platform.
Data correspond to usage on the plateform after 2015. The current usage metrics is available 48-96 hours after online publication and is updated daily on week days.
Initial download of the metrics may take a while.