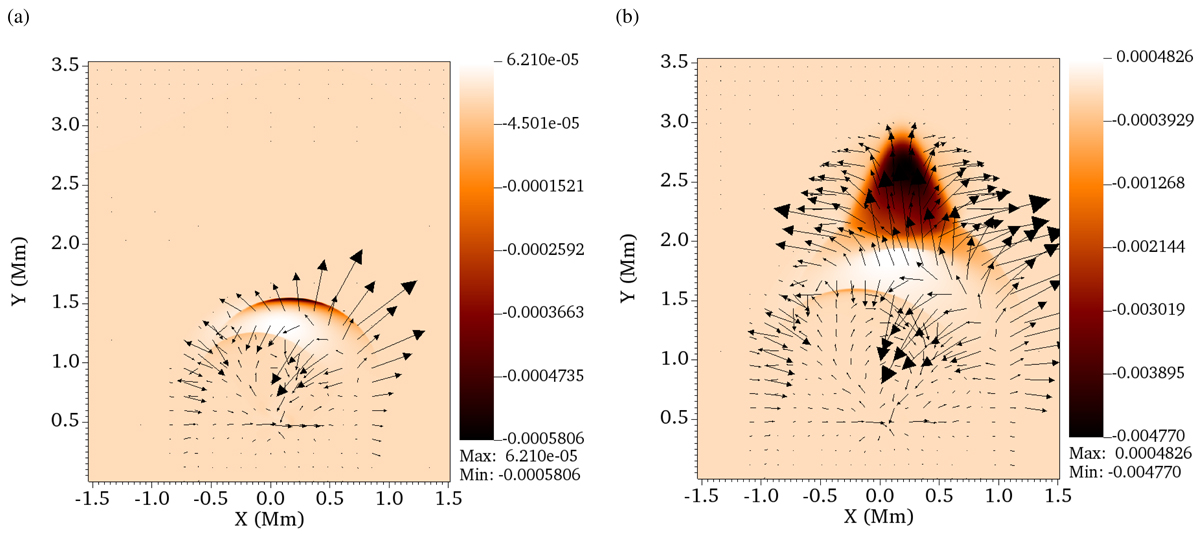
Fig. 6.
Download original image
Snapshots of transversal velocity Viz (color map), expressed in the units of km s−1, and velocity vectors (arrows) at t = 100 s (a) and t = 135 s (b) for B = [0, 10, 2] Gs. This configuration leads to the generation of MAWs waves which are coupled to Alfvén waves. Here, the spatial profile of Viz (color map) represents the presence of both Alfvén and MAWs in the chromosphere (0.5 ≤ y ≤ 2 Mm) and in the higher layers of the solar atmosphere. The black arrows indicate the direction of the plasma flow.
Current usage metrics show cumulative count of Article Views (full-text article views including HTML views, PDF and ePub downloads, according to the available data) and Abstracts Views on Vision4Press platform.
Data correspond to usage on the plateform after 2015. The current usage metrics is available 48-96 hours after online publication and is updated daily on week days.
Initial download of the metrics may take a while.