Open Access
Fig. 5.
Download original image
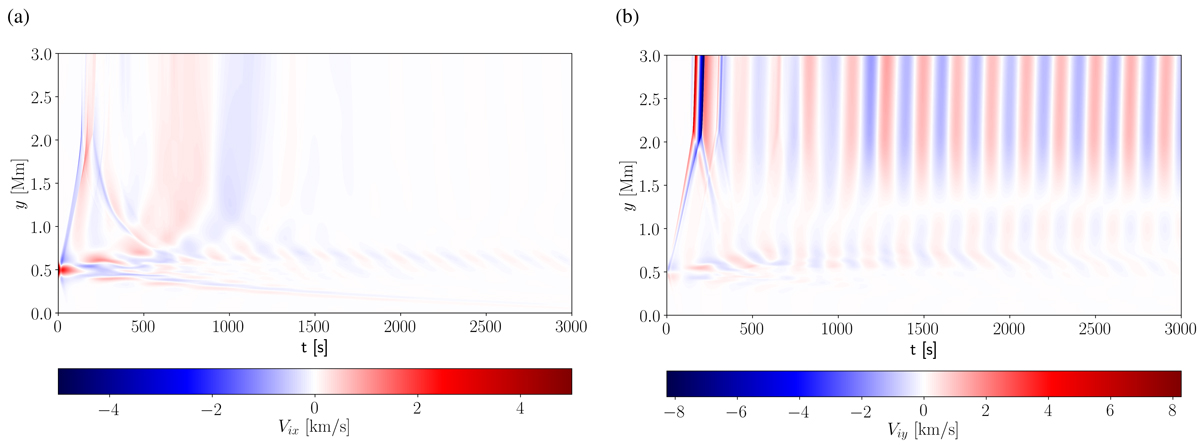
Time-distance plots for Vix (a) and Viy (b) corresponding to MAWs for B = [0, 10, 0] Gs. These plots correspond to the slices collected at x = 0 Mm along y in Fig. 4. The blue and red bands in both panels indicate the propagation of waves with time.
Current usage metrics show cumulative count of Article Views (full-text article views including HTML views, PDF and ePub downloads, according to the available data) and Abstracts Views on Vision4Press platform.
Data correspond to usage on the plateform after 2015. The current usage metrics is available 48-96 hours after online publication and is updated daily on week days.
Initial download of the metrics may take a while.