Open Access
Fig. 10.
Download original image
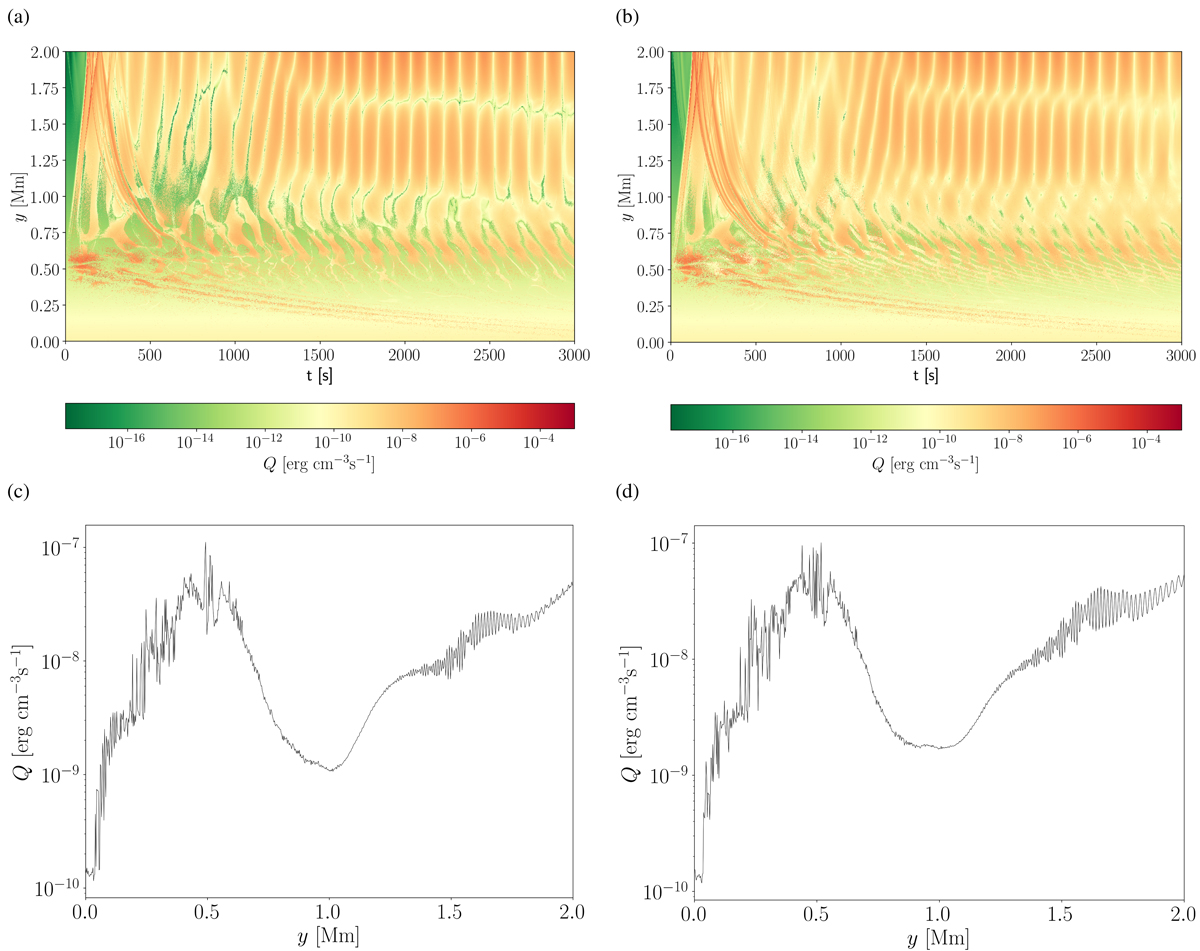
Time-distance plots for thermal energy rate, Q (a, b), and the corresponding vertical time-averaged profile (c, d) in the case of B = [0, 10, 0] Gs (a, c) and B = [0, 10, 2] Gs (b, d). The time distance plots and corresponding time average profile represent the thermal energy rate due to the first term at RHS in Eq. (10).
Current usage metrics show cumulative count of Article Views (full-text article views including HTML views, PDF and ePub downloads, according to the available data) and Abstracts Views on Vision4Press platform.
Data correspond to usage on the plateform after 2015. The current usage metrics is available 48-96 hours after online publication and is updated daily on week days.
Initial download of the metrics may take a while.