| Issue |
A&A
Volume 680, December 2023
|
|
|---|---|---|
| Article Number | L18 | |
| Number of page(s) | 4 | |
| Section | Letters to the Editor | |
| DOI | https://doi.org/10.1051/0004-6361/202348372 | |
| Published online | 19 December 2023 | |
Letter to the Editor
Accretion in the recurrent nova T CrB: Linking the superactive state to the predicted outburst⋆
1
Institute of Astronomy and National Astronomical Observatory, Bulgarian Academy of Sciences, Tsarigradsko Shose 72, 1784 Sofia, Bulgaria
e-mail: This email address is being protected from spambots. You need JavaScript enabled to view it.
2
Astrophysics Research Institute, Liverpool John Moores University, IC2, 149 Brownlow Hill, Liverpool L3 5RF, UK
3
Office of the Vice Chancellor, Botswana International University of Science and Technology, Private Bag 16, Palapye, Botswana
4
Department of Physics and Astronomy, Shumen University “Episkop Konstantin Preslavski”, 115 Universitetska Str., 9700 Shumen, Bulgaria
Received:
24
October
2023
Accepted:
5
December
2023
Abstract
Context. T CrB (NOVA CrB 1946) is a famous recurrent nova with a recurrence timescale of 80 years.
Aims. We aim to estimate the colours, luminosity, and mass-accretion rate for T CrB (NOVA CrB 1946) during and after the superactive state.
Methods. We performed and analysed UBV photometry of the recurrent nova T CrB.
Results. For the hot component of T CrB, we find average dereddened colours of (U − B)0 = −0.70 ± 0.08 and (B − V)0 = 0.23 ± 0.06, which correspond to an effective temperature of 9400 ± 500 K and an optical luminosity of 40 − 110 L⊙ during the superactive state (2016–2022). After the end of the superactive state, the hot component became significantly redder, (U − B)0 ≈ −0.3 and (B − V)0 ≈ 0.6 in August 2023, and its luminosity decreased markedly to 20 − 25 L⊙ in April–May 2023, and to 8 − 9 L⊙ in August 2023. The total mass accreted during the superactive state from 2014 to 2023 is ∼2 × 10⁻⁷ M⊙.
Conclusions. This is a significant fraction of the mass required to cause a thermonuclear runaway (TNR). Overall our results support a model in which a large accretion disc acts as a reservoir with increased accretion rate onto the central white dwarf during disc high states, ultimately leading to a TNR explosion, which now seems to be imminent.
Key words: accretion, accretion disks / binaries: symbiotic / stars: individual: T CrB / novae, cataclysmic variables
The data are available on https://zenodo.org/records/10283430
© The Authors 2023
 Open Access article, published by EDP Sciences, under the terms of the Creative Commons Attribution License (https://creativecommons.org/licenses/by/4.0), which permits unrestricted use, distribution, and reproduction in any medium, provided the original work is properly cited.
This article is published in open access under the Subscribe to Open model. This email address is being protected from spambots. You need JavaScript enabled to view it. to support open access publication.
1. Introduction
T Coronae Borealis (HD 143454) is a famous recurrent nova, with recorded eruptions in 1866 and 1946 and possibly in 1217 and 1787 (Schaefer 2023a). A new outburst is expected over the coming 12 months (Schaefer 2023b; Maslennikova et al. 2023) and is the subject of a great deal of preparatory work among the international astronomical community. The consensus is that T CrB would be the brightest nova outburst observed since Nova 1500 Cyg in 1975. The likely presence of a dense wind from the red giant (see below) will also lead to shock systems as the outburst ejecta encounter it, as in the recurrent nova RS Oph (e.g. Bode & Kahn 1985). Major advances in understanding its nature were made when Sanford (1949) discovered that the radial velocity of the M giant of T CrB varies with a period of 230.5 days and when Selvelli et al. (1992), using IUE spectra, identified that the hot component of the system is a white dwarf accretor. In this binary, the ellipsoid-shaped red giant fills its Roche lobe and transfers material via the inner Lagrangian point L1. This type of nova is also referred to as a symbiotic recurrent nova (e.g. Bode 2010; Shore et al. 2011). Indeed, T CrB shares characteristics with three types of interacting binary (recurrent novae, symbiotic stars, and cataclysmic variables), and is an important object for understanding accretion, disc instabilities, and nova outbursts.
From 2016 until 2023, T CrB was in a superactive state (Munari et al. 2016; Munari 2023). which was characterised by a large increase in the mean brightness and the appearance of strong and high-ionization emission lines (HeII4686, [OIII]4959, 5007, [NeIII]3869, etc.) and a prominent soft X-ray component (Zhekov & Tomov 2019). Here, we analyse UBV photometry obtained during and after the superactive state and estimate key system parameters in terms of the colours and the optical luminosity of the hot component.
2. Observations
UBV photometry was obtained on 18 nights between 2016 and 2023. The observations were performed with the 50/70 cm Schmidt, the 1.5 m, and the 2.0 m RCC telescopes of the Rozhen National Astronomical Observatory. Comparison stars from the list by Henden & Munari (2006) were used. Some of the data obtained were announced in The Astronomer’s Telegrams (Zamanov et al. 2016, 2023; Minev et al. 2023).
3. Results
3.1. System parameters
Hereafter, for T CrB, we adopt an orbital period of 227.5687 d, T0 (HJD) 2 447 918.62 (Fekel et al. 2000), a mass of the white dwarf of 1.37 ± 0.13 M⊙, a mass of the red giant of 1.12 ± 0.23 M⊙, and an inclination of  (Stanishev et al. 2004). These are formal error bars, but the upper bound on the mass of the white dwarf is of course set by the Chandrasehkar Limit.
Following Kepler’s third law, the distance between the components is a = 213 R⊙. We adopt a distance of d = 914 pc (Schaefer 2022), which is similar to the value d = 890 pc (Bailer-Jones et al. 2021) based on the Gaia EDR3 (Gaia Collaboration 2021). We also adopt interstellar extinction E(B − V)=0.07 (Nikolov 2022). This value is consistent with the Galactic dust reddening maps by Schlegel et al. (1998) and Schlafly & Finkbeiner (2011), which give E(B − V)≤0.071 (calculated with the NASA/NED extinction calculator).
3.2. UBV photometry
The left panel of Fig. 1 shows a two-colour diagram, (U − B)0 versus (B − V)0, for T CrB. Typical errors are ±0.01 mag. The right panel shows the colours of its hot component after the subtraction of the red giant contribution. The black solid lines are for main sequence stars (taken from Schmidt-Kaler 1982) and for a black body. The black body temperature is marked for some of the points.
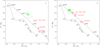 |
Fig. 1. Two-colour diagram (U − B)0 versus (B − V)0. The left panel shows the dereddened colours of T CrB. The right panel shows the hot component (red giant subtracted). The green colours denote observations obtained during the superactive state (2016–2022), and the red colours relate to observations made shortly afterwards (April–October 2023). More details can be found in Table 1. |
From Fig. 1a, it is apparent that during the superactive state (green symbols), the colours of T CrB are around (U − B)0 = −0.36 ± 0.11 and (B − V)0 = 0.85 ± 0.09. During 2023 (red symbols), T CrB becomes gradually redder (U − B)0 = 0.1, (B − V)0 = 1.2 in April–May 2023, (U − B)0 = 0.7, (B − V)0 = 1.5 in August 2023, and (U − B)0 = 1.0, (B − V)0 = 1.5 in October 2023.
3.3. Cool component
Kenyon & Fernandez-Castro (1987) analysed the prominent absorption features on the red spectra (λλ5500 − 8600 Å) of symbiotic stars and classified the cool component of T CrB as M4 III. Using eight-colour near-infrared (NIR) photometry, Keyes & Preblich (2004) find the red giant is an M4.4 Ib – II. Based on NIR spectra in the range 7900−9300 Å, Zhu et al. (1999) derived M3.8 III. Mürset & Schmid (1999), also using NIR spectra (7000−10 000 Å), find a spectral type of M4.5.
Using d = 914 pc, V = 10.37, and E(B − V)=0.07, we calculate an absolute V band magnitude for the system in the low state MV ≈ +0.4, which is one magnitude fainter than the expected MV ≈ −0.6 for a typical M4III star (e.g. Table 2 in Straizys & Kuriliene 1981). Nevertheless, the value MV ≈ +0.4 is more appropriate for luminosity class III. It is not consistent with −3 ≥ MV ≥ −6 expected for luminosity classes I–II, nor with MV ≈ +10 for luminosity class V. For the cool component, we therefore adopt a spectral type of M4 III, ellipsoidal variability in the form V0 = 10.16 − 0.2 cos4πϕ, and colours U − B0 = 1.65, B − V0 = 1.63, which are the colours of an M4.5 III giant (Schmidt-Kaler 1982).
3.4. Accretion luminosity
From the UBV data, we calculate the dereddened magnitude U0, and the dereddened colours of the hot component. To estimate the luminosity of the hot component, we applied the following procedure: 1. We correct the observed magnitudes for the interstellar extinction. 2. We subtract the contribution of the red giant using the calibrations for generic Bessell UBV filters given in Rodrigo & Solano (2020). 3. We calculate U0, (U − B)0 and (B − V)0 of the hot component. 4. Using (U − B)0 and (B − V)0 and the calibration for a black body (Table 18 in Straižys 1992), we calculate the effective temperature1. 5. Using a distance of d = 914 pc, and the dereddened magnitude U0, we calculate the effective radius and the optical luminosity of the hot component.
Table 1 gives the date, Julian day, orbital phase, dereddened U0 band magnitude of the hot component, dereddened colours (U − B)0 and (B − V)0 of the hot component, and its optical luminosity. The errors in the colours depend on the subtraction of the red giant; in a bright state, they are ±0.03 for (U − B)0 and ±0.06 for (B − V)0, and are two times larger in a low state. The typical error on the temperature is less than ±700 K. The error on the estimated luminosity is of about ±7% in the bright state, and is two times larger in low state.
Dereddened colours and luminosity of the hot component.
3.5. Temperature and luminosity of the hot component
From Fig. 1b and Table 1 it can be seen that, during the superactive state, the colours of the hot component cluster around (U − B)0 = −0.70 ± 0.08 and (B − V)0 = 0.23 ± 0.06. The average effective temperature during 2016–2021 is 9400 ± 600 K. During 2023, after the end of the superactive state, the hot component becomes gradually redder and its effective temperature decreases from 9400 K down to ≈5000 K. We find that the optical luminosity of the hot component is 40 − 110 L⊙ during the superactive state. This decreased to 20 − 25 L⊙ in April–May 2023, and to 8 − 9 L⊙ after the end of the superactive state in August 2023.
3.6. Mass-accretion rate
The optical luminosity of the hot component is connected to the mass-accretion rate:  (supposing that the main source is the accretion disc), where G is the gravitational constant, Ṁa is the mass-accretion rate, Rwd is the white dwarf radius, and i is the inclination. For the radius of the white dwarf, we adopt Rwd = 2018 km, which we calculated using the Eggleton formula as given in Verbunt & Rappaport (1988). Ṁa calculated in this way is given in the last column of Table 1.
During the superactive state, we find an average of Ṁa ≈ 2 × 10⁻⁸ M⊙ yr−1 and a maximum of 4 × 10⁻⁸ M⊙ yr−1 (the uncertainty is of about ±30%). However, if we assume the geometrical size of the boundary layer between the white dwarf and the accretion disc is approximately equal to two white dwarf radii (Bruch & Duschl 1993), then this value would be two times larger. If we assume a slightly lower mass of the white dwarf of Mwd = 1.2 M⊙ (Belczynski & Mikolajewska 1998), and a corresponding Rwd = 3859 km, this latter value is two times larger.
This means that the total mass accreted during the superactive state from 2014 to 2023 is in the range 1.2 × 10⁻⁷ − 5 × 10⁻⁷ M⊙, with the most likely value being 1.7 × 10⁻⁷ M⊙.
4. Discussion
Luna et al. (2020) suggest that the white dwarfs in T CrB and other symbiotic recurrent novae accumulate most of the ignition mass during sporadic high states. Hints of such episodes were also noticed by Nelson et al. (2011) in the X-ray data of the symbiotic recurrent nova RS Oph. In late 2014, T CrB entered a superactive state that peaked in April 2016 and ended in mid-2023 (Munari et al. 2016; Munari 2023). Iłkiewicz et al. (2023) pointed out that this superactive state of T CrB is similar to the superoutbursts observed in SU UMa-type dwarf novae.
We find that the optical luminosity of the hot component was 50 − 110 L⊙ during the early stages of the superactive state (February–April 2016) and stayed at a level ≈40 − 50 L⊙ until 2022. The luminosity decreased to 20 − 25 L⊙ in April–May 2023, and to 8 − 9 L⊙ after the end of the superactive state in August 2023. As the luminosity decreases, the hot component becomes redder and its effective temperature also decreases. There several possible drivers of the decrease in the optical brightness of T CrB in 2023: (1) A decrease in the mass-accretion rate may have led to this decrease, because the accumulated material in the disc is exhausted and a new phase of accumulation begins. (2) The red giant transferred a lot of material during the period 2014−2023, and then shrank and transferred less material via L1. (3) Schaefer et al. (2023) consider that this is a pre-outburst dip and is a signal that a nova eruption will be observed in the coming months. If it is a pre-outburst dip, it could be connected to the formation of a dense, near-to-critical mass envelope around the white dwarf (Zamanov et al. 2024).
Wynn (2008) discussed the possibility that the accretion disc in a symbiotic recurrent nova acts as a reservoir of mass containing up to 10−6 M⊙. The disc is large, with the mass required for the TNR being accreted during a few large and bright disc outbursts (for more details, see Wynn 2008, Sect. 3.1). In such a scenario, during the disc outburst phases, the accretion disc is hot and the accretion rate is high. Our results for the behaviour of T CrB during 2016–2023 (see Figs. 1a, b and Table 1) are in good agreement with these considerations. If a nova outburst happens over the following 12 months, this would be an indication that one superactive state (disc superoutburst of SU UMa type) can be sufficient to cause a TNR.
The total mass accreted during the superactive state from 2014 to 2022 is ≈2 × 10⁻⁷ M⊙, which is a considerable fraction (∼30%) of the amount that needs to be accumulated for a TNR (5 × 10⁻⁷ − 1.6 × 10⁻⁶ M⊙; José et al. 2020; Shara et al. 2018). Whether or not the material accumulated on the white dwarf is sufficient to cause a TNR, resulting in a nova eruption, is an open question, which may well be answered in the coming year.
5. Conclusions
We analysed UBV photometry of the recurrent nova T CrB obtained during 2016–2023. After subtraction of the contribution of the red giant, we find average dereddened colours of the hot component of (U − B)0 = −0.70 ± 0.08 and (B − V)0 = 0.23 ± 0.06 during the period 2016–2022. We estimate the optical luminosity of the hot component to be 40 − 110 L⊙ during the superactive state. After the end of the superactive state, the hot component became redder and its luminosity decreased to 20 − 25 L⊙ in April–May 2023, and to 8 − 9 L⊙ in August 2023. The total mass accreted during the superactive state from 2014 to 2023 is ∼2 × 10⁻⁷ M⊙, which is ∼30% of the total mass needed for a nova outburst powered by a TNR.
The assumption of black body emission is a first approximation, as the true spectrum is likely to be that of an accretion disc. However, the results shown in Fig. 1b indicate that black body emission is not an unreasonable assumption at this stage.
Acknowledgments
The research infrastructure is supported by the Ministry of Education and Science of Bulgaria (Bulgarian National Roadmap for Research Infrastructure) and by the Bulgarian National Science Fund. D.M. acknowledges support by project RD-08-157/2023 from Shumen University Science Fund.
References
- Bailer-Jones, C. A. L., Rybizki, J., Fouesneau, M., Demleitner, M., & Andrae, R. 2021, AJ, 161, 147 [Google Scholar]
- Belczynski, K. & Mikolajewska, J. 1998, MNRAS, 296, 77 [CrossRef] [Google Scholar]
- Bode, M. F. 2010, Astron. Nachr., 331, 160 [NASA ADS] [CrossRef] [Google Scholar]
- Bode, M. F., & Kahn, F. D. 1985, MNRAS, 217, 205 [NASA ADS] [CrossRef] [Google Scholar]
- Bruch, A., & Duschl, W. J. 1993, A&A, 275, 219 [NASA ADS] [Google Scholar]
- Fekel, F. C., Joyce, R. R., Hinkle, K. H., & Skrutskie, M. F. 2000, AJ, 119, 1375 [NASA ADS] [CrossRef] [Google Scholar]
- Gaia Collaboration (Brown, A. G. A., et al.) 2021, A&A, 649, A1 [NASA ADS] [CrossRef] [EDP Sciences] [Google Scholar]
- Henden, A., & Munari, U. 2006, A&A, 458, 339 [NASA ADS] [CrossRef] [EDP Sciences] [Google Scholar]
- Iłkiewicz, K., Mikołajewska, J., & Stoyanov, K. A. 2023, ApJ, 953, L7 [CrossRef] [Google Scholar]
- José, J., Shore, S. N., & Casanova, J. 2020, A&A, 634, A5 [EDP Sciences] [Google Scholar]
- Kenyon, S. J., & Fernandez-Castro, T. 1987, AJ, 93, 938 [CrossRef] [Google Scholar]
- Keyes, C. D., & Preblich, B. 2004, AJ, 128, 2981 [NASA ADS] [CrossRef] [Google Scholar]
- Luna, G. J. M., Sokoloski, J. L., Mukai, K., & Kuin, M. N. P. 2020, ApJ, 902, L14 [NASA ADS] [CrossRef] [Google Scholar]
- Maslennikova, N. A., Tatarnikov, A. M., Tatarnikova, A. A., et al. 2023, Astron. Lett., submitted [arXiv:2308.10011] [Google Scholar]
- Minev, M., Zamanov, R., & Stoyanov, K. 2023, ATel, 16023, 1 [NASA ADS] [Google Scholar]
- Munari, U. 2023, Res. Notes Am. Astron. Soc., 7, 145 [Google Scholar]
- Munari, U., Dallaporta, S., & Cherini, G. 2016, New Astron., 47, 7 [NASA ADS] [CrossRef] [Google Scholar]
- Mürset, U., & Schmid, H. M. 1999, A&AS, 137, 473 [NASA ADS] [CrossRef] [EDP Sciences] [Google Scholar]
- Nelson, T., Mukai, K., Orio, M., Luna, G. J. M., & Sokoloski, J. L. 2011, ApJ, 737, 7 [NASA ADS] [CrossRef] [Google Scholar]
- Nikolov, Y. 2022, New Astron., 97, 101859 [NASA ADS] [CrossRef] [Google Scholar]
- Rodrigo, C., & Solano, E. 2020, XIV.0 Scientific Meeting (virtual) of the Spanish Astronomical Society, 182 [Google Scholar]
- Sanford, R. F. 1949, ApJ, 109, 81 [NASA ADS] [CrossRef] [Google Scholar]
- Schaefer, B. E. 2022, MNRAS, 517, 6150 [NASA ADS] [CrossRef] [Google Scholar]
- Schaefer, B. 2023a, J. Hist. Astron., 54, 436 [CrossRef] [Google Scholar]
- Schaefer, B. E. 2023b, MNRAS, 524, 3146 [NASA ADS] [CrossRef] [Google Scholar]
- Schaefer, B. E., Kloppenborg, B., Waagen, E. O., & Observers, T. A. 2023, ATel, 16107, 1 [NASA ADS] [Google Scholar]
- Schlafly, E. F., & Finkbeiner, D. P. 2011, ApJ, 737, 103 [Google Scholar]
- Schlegel, D. J., Finkbeiner, D. P., & Davis, M. 1998, ApJ, 500, 525 [Google Scholar]
- Schmidt-Kaler, T. 1982, Landolt-Börnstein – Group VI Astronomy and Astrophysics, Volume 2B, Stars and Star Clusters (Berlin: Springer-Verlag), 1 [Google Scholar]
- Selvelli, P. L., Cassatella, A., & Gilmozzi, R. 1992, ApJ, 393, 289 [NASA ADS] [CrossRef] [Google Scholar]
- Shara, M. M., Prialnik, D., Hillman, Y., & Kovetz, A. 2018, ApJ, 860, 110 [NASA ADS] [CrossRef] [Google Scholar]
- Shore, S. N., Wahlgren, G. M., Augusteijn, T., et al. 2011, A&A, 527, A98 [NASA ADS] [CrossRef] [EDP Sciences] [Google Scholar]
- Stanishev, V., Zamanov, R., Tomov, N., & Marziani, P. 2004, A&A, 415, 609 [NASA ADS] [CrossRef] [EDP Sciences] [Google Scholar]
- Straižys, V. 1992, Multicolor Stellar Photometry (Tucson: Pachart Pub House) [Google Scholar]
- Straizys, V., & Kuriliene, G. 1981, Ap&SS, 80, 353 [CrossRef] [Google Scholar]
- Verbunt, F., & Rappaport, S. 1988, ApJ, 332, 193 [NASA ADS] [CrossRef] [Google Scholar]
- Wynn, G. 2008, in RS Ophiuchi (2006) and the Recurrent Nova Phenomenon, eds. A. Evans, M. F. Bode, T. J. O’Brien, & M. J. Darnley, ASP Conf. Ser., 401, 73 [NASA ADS] [Google Scholar]
- Zamanov, R., Semkov, E., Stoyanov, K., & Tomov, T. 2016, ATel, 8675, 1 [NASA ADS] [Google Scholar]
- Zamanov, R., Semkov, E., Kostov, A., Boeva, S., & Latev, G. 2023, ATel, 16213, 1 [NASA ADS] [Google Scholar]
- Zamanov, R. K., Marchev, V., Marti, J., & Latev, G. Y. 2024, Bulg. J. Phys., submitted [arXiv:2308.04104] [Google Scholar]
- Zhekov, S. A., & Tomov, T. V. 2019, MNRAS, 489, 2930 [NASA ADS] [CrossRef] [Google Scholar]
- Zhu, Z. X., Friedjung, M., Zhao, G., Hang, H. R., & Huang, C. C. 1999, A&AS, 140, 69 [NASA ADS] [CrossRef] [EDP Sciences] [Google Scholar]
All Tables
All Figures
|
Fig. 1. Two-colour diagram (U − B)0 versus (B − V)0. The left panel shows the dereddened colours of T CrB. The right panel shows the hot component (red giant subtracted). The green colours denote observations obtained during the superactive state (2016–2022), and the red colours relate to observations made shortly afterwards (April–October 2023). More details can be found in Table 1. |
| In the text | |
Current usage metrics show cumulative count of Article Views (full-text article views including HTML views, PDF and ePub downloads, according to the available data) and Abstracts Views on Vision4Press platform.
Data correspond to usage on the plateform after 2015. The current usage metrics is available 48-96 hours after online publication and is updated daily on week days.
Initial download of the metrics may take a while.