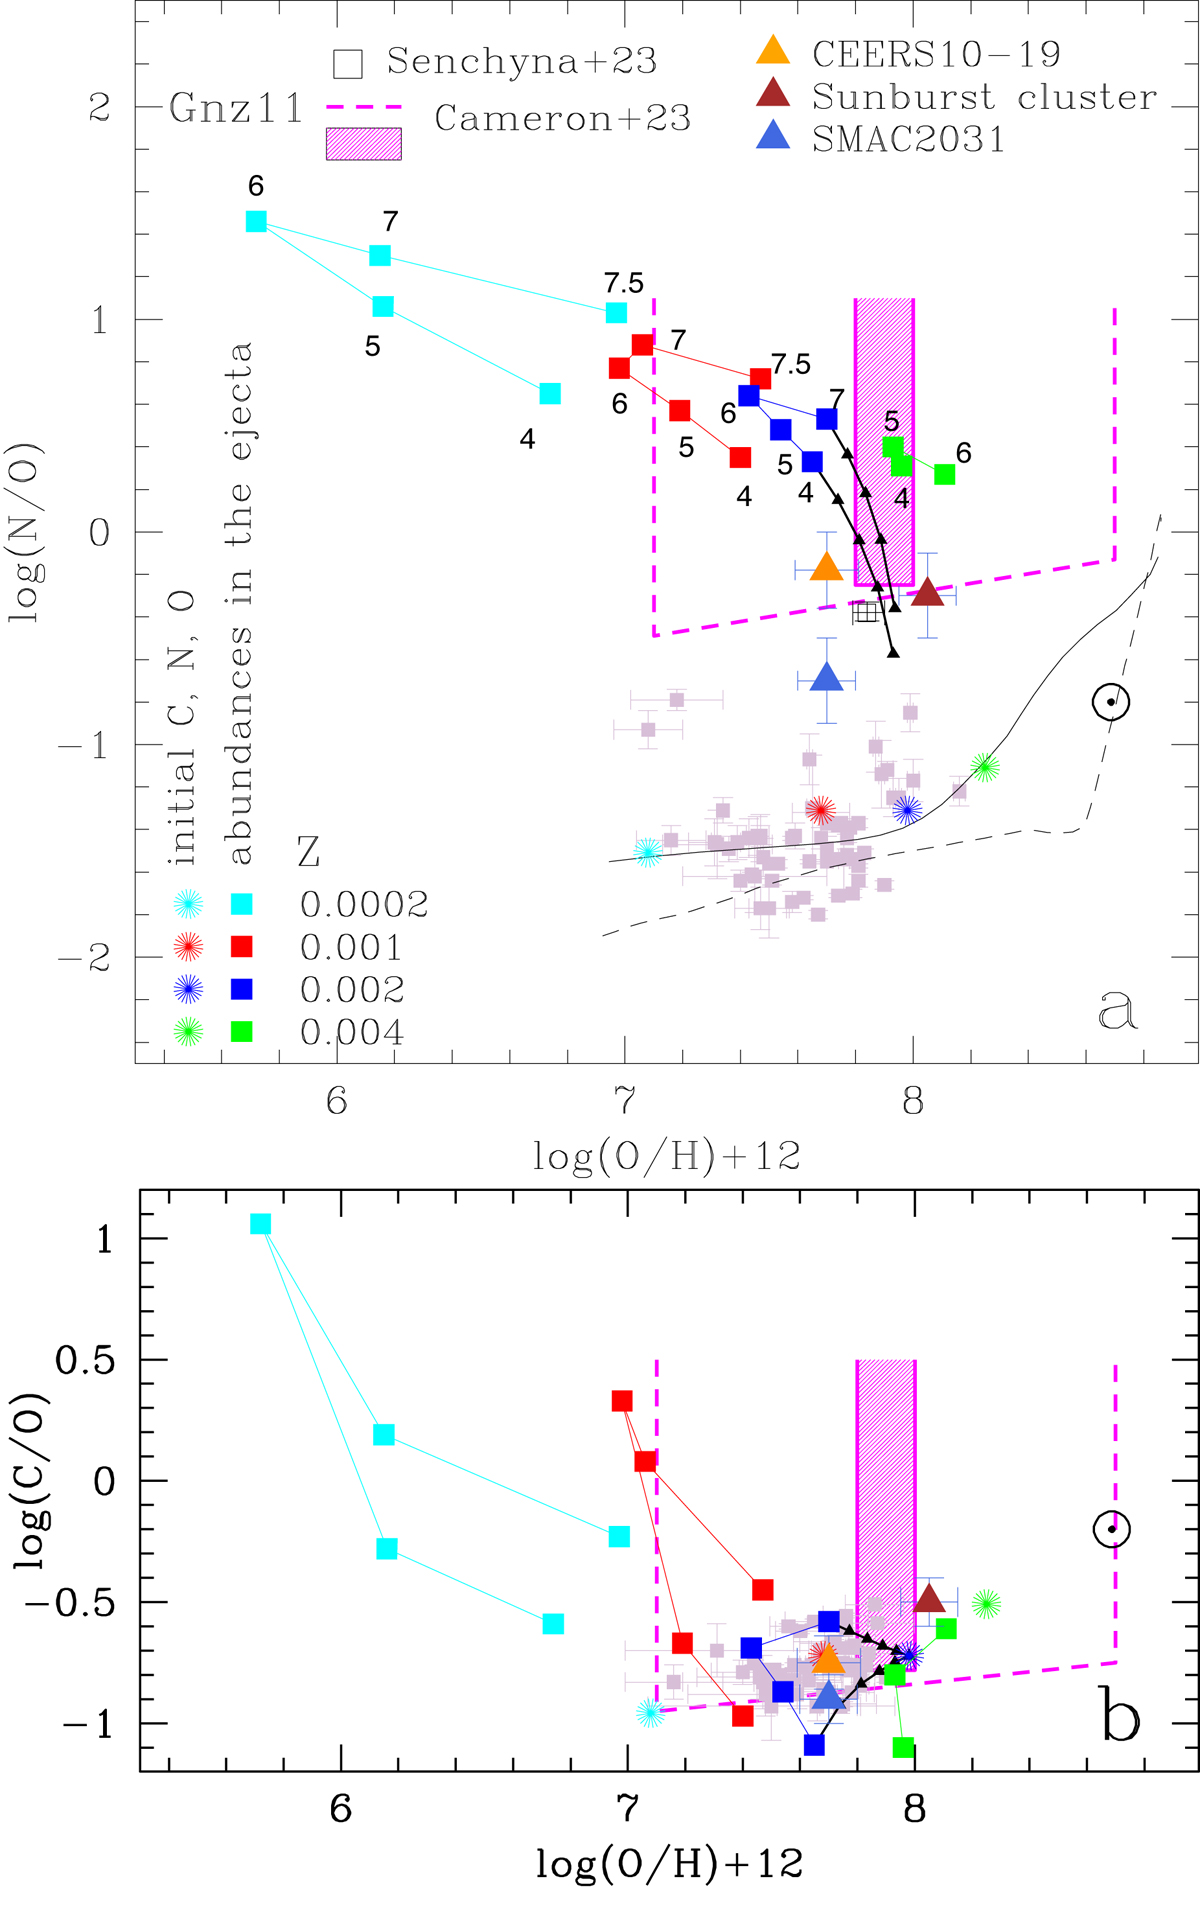
Fig. 1.
Download original image
Abundances in GN-z11 and other objects, compared with models. Panel a: diagram log(N/O) versus log(O/H)+12: “fiducial” (pink filled) and “conservative” (pink dashed border) error boxes for GN-z11 (Cameron et al. 2023). Black open square with error bars: abundances from Senchyna et al. (2023). Colored squares: average abundances ratios in the ejecta of intermediate mass AGB stars (Ventura et al. 2013). Metallicities in mass fraction Z and masses (from 7.5 to 4 M⊙) are labelled in the figure. Asterisks: initial O/H and N/O abundances of the models (see Table 1 and Ventura et al. 2013). Solar symbol is placed at the values corresponding to solar abundances. Black lines: examples of dilution of the ejecta (of the 4 and 7 M⊙ at Z = 0.002) with gas having the initial chemical composition; triangles are marking 20, 40, 60 and 80% of diluting pristine gas. Thistle squares with error bars: abundances observed in low metallicity galaxies at z = 0.3–0.4 (Izotov et al. 2023) and in the local compact galaxies from the SLOAN (Izotov et al. 2012). At the bottom: upper (full) and lower (dashed) envelope of the chemical evolution models by Vincenzo et al. (2016). Other star forming galaxies at high redshift having high log(N/O) are shown as colored triangles and are identified in the labels. Panel b: diagram log(C/O) versus log(O/H)+12. Symbols and lines as in panel a.
Current usage metrics show cumulative count of Article Views (full-text article views including HTML views, PDF and ePub downloads, according to the available data) and Abstracts Views on Vision4Press platform.
Data correspond to usage on the plateform after 2015. The current usage metrics is available 48-96 hours after online publication and is updated daily on week days.
Initial download of the metrics may take a while.