Fig. 9.
Download original image
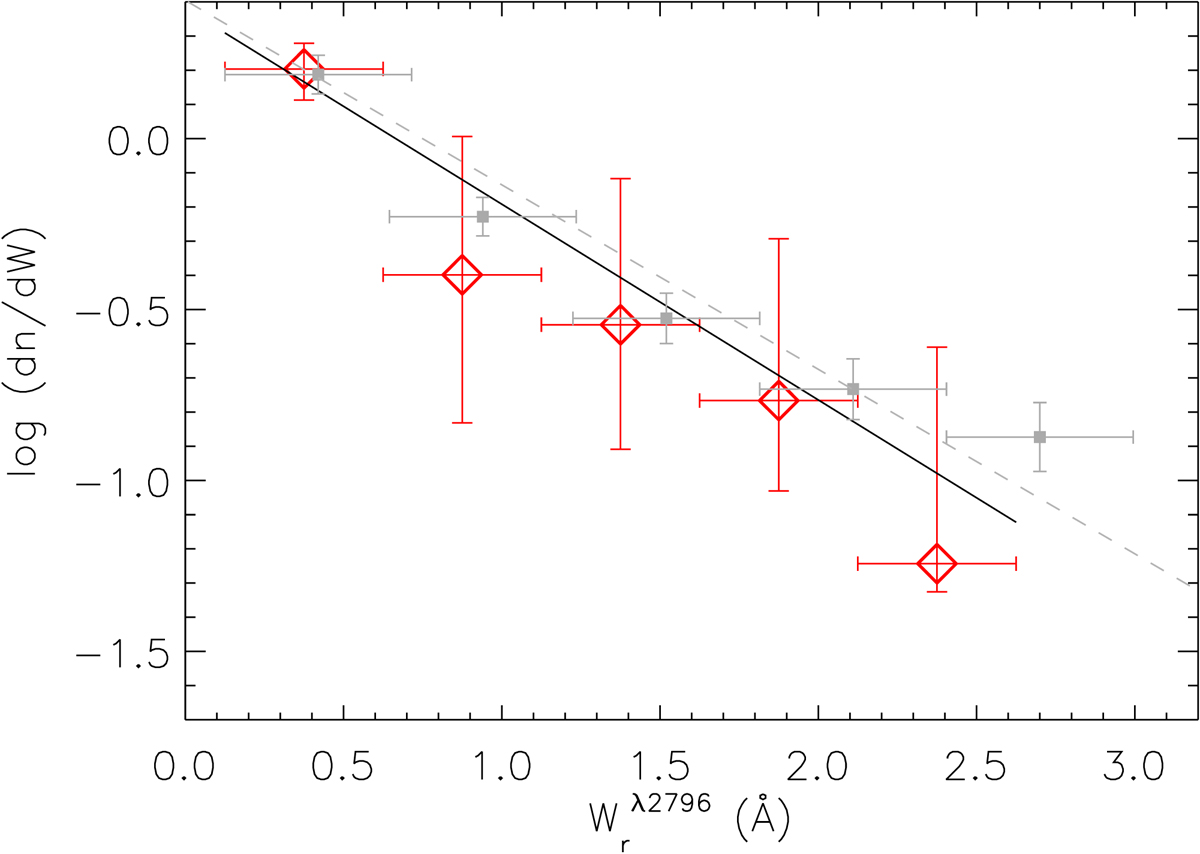
Distribution of Mg II equivalent widths from all systems across the redshift interval from z = 2.5 − 7.5. The best fit is illustrated by the solid line. Compared to much larger quasar surveys at lower redshifts (Chen et al. 2017), where the dashed line is the best fit, there is no evidence for a different distribution in the NIRSpec data.
Current usage metrics show cumulative count of Article Views (full-text article views including HTML views, PDF and ePub downloads, according to the available data) and Abstracts Views on Vision4Press platform.
Data correspond to usage on the plateform after 2015. The current usage metrics is available 48-96 hours after online publication and is updated daily on week days.
Initial download of the metrics may take a while.