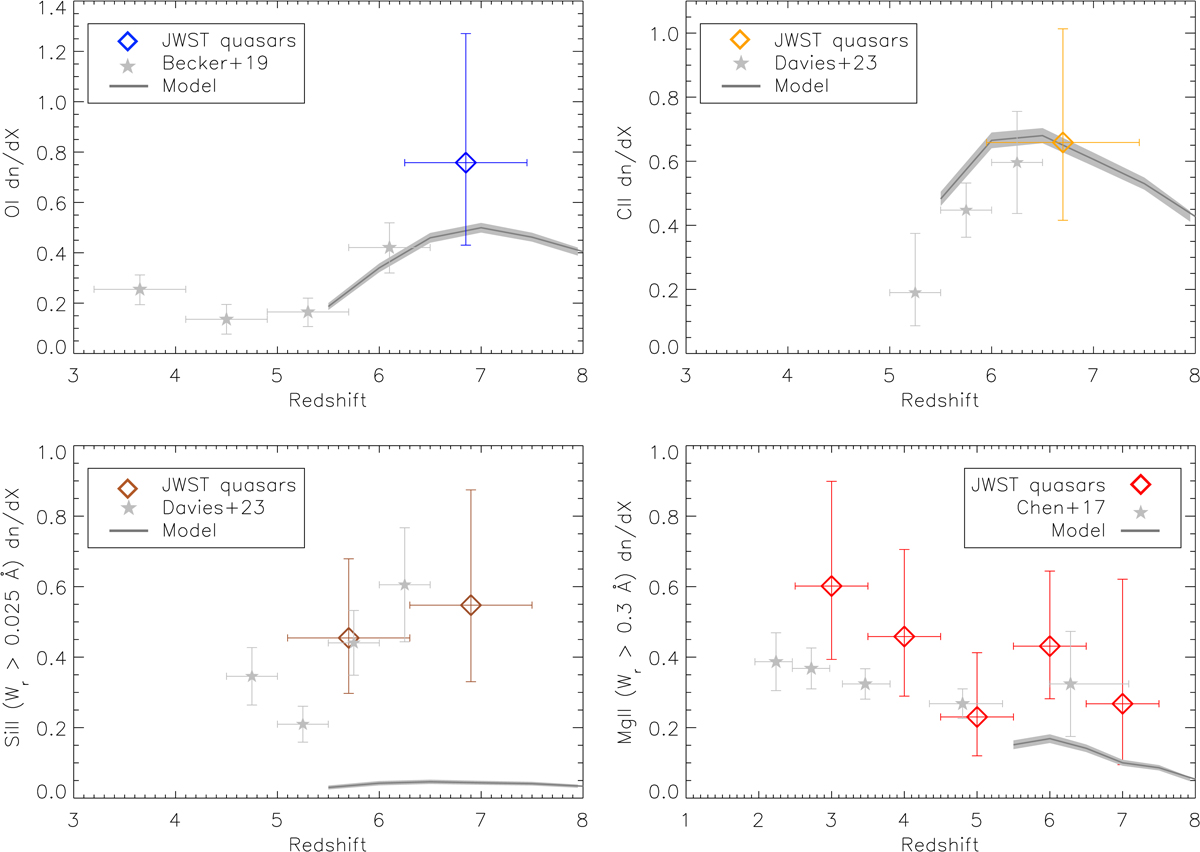
Fig. 8.
Download original image
Line densities as a function of redshift for low-ionisation lines. In all panels, coloured symbols represent the JWST data, where error bars for the line densities represent 68% confidence intervals for small-number Poisson uncertainties (Gehrels 1986). The line densities are compared to predictions from numerical models (Huscher et al., in prep.) computed from the same selection of Wr as from the NIRSpec observations. Upper left panel: O Iλ1302 absorption line densities for systems with Wr > 0.05 Å showing an increase in line density at z > 6.5 from the NIRSpec data compared to lower redshifts (Becker et al. 2019). Upper right panel: C IIλ1334 absorption line densities for systems with Wr > 0.03 Å compared to lower redshift values derived from the catalogue in Davies et al. (2023b). Lower left panel: Si IIλ1526 absorption line densities for systems with Wr > 0.025 Å compared to that derived from the absorption database in Davies et al. (2023b). The model prediction at dn/dX ≈ 0.04 under-produces the Si II line densities by a factor of ≈12. Lower right panel: Mg IIλ2796 absorption line densities for systems with Wr > 0.3 Å. Compared to the Mg II study in (Chen et al. 2017), the NIRSpec data suggest that the line density could be constant or have a shallow decrease with increasing redshifts in agreement with the model prediction.
Current usage metrics show cumulative count of Article Views (full-text article views including HTML views, PDF and ePub downloads, according to the available data) and Abstracts Views on Vision4Press platform.
Data correspond to usage on the plateform after 2015. The current usage metrics is available 48-96 hours after online publication and is updated daily on week days.
Initial download of the metrics may take a while.