Fig. 5.
Download original image
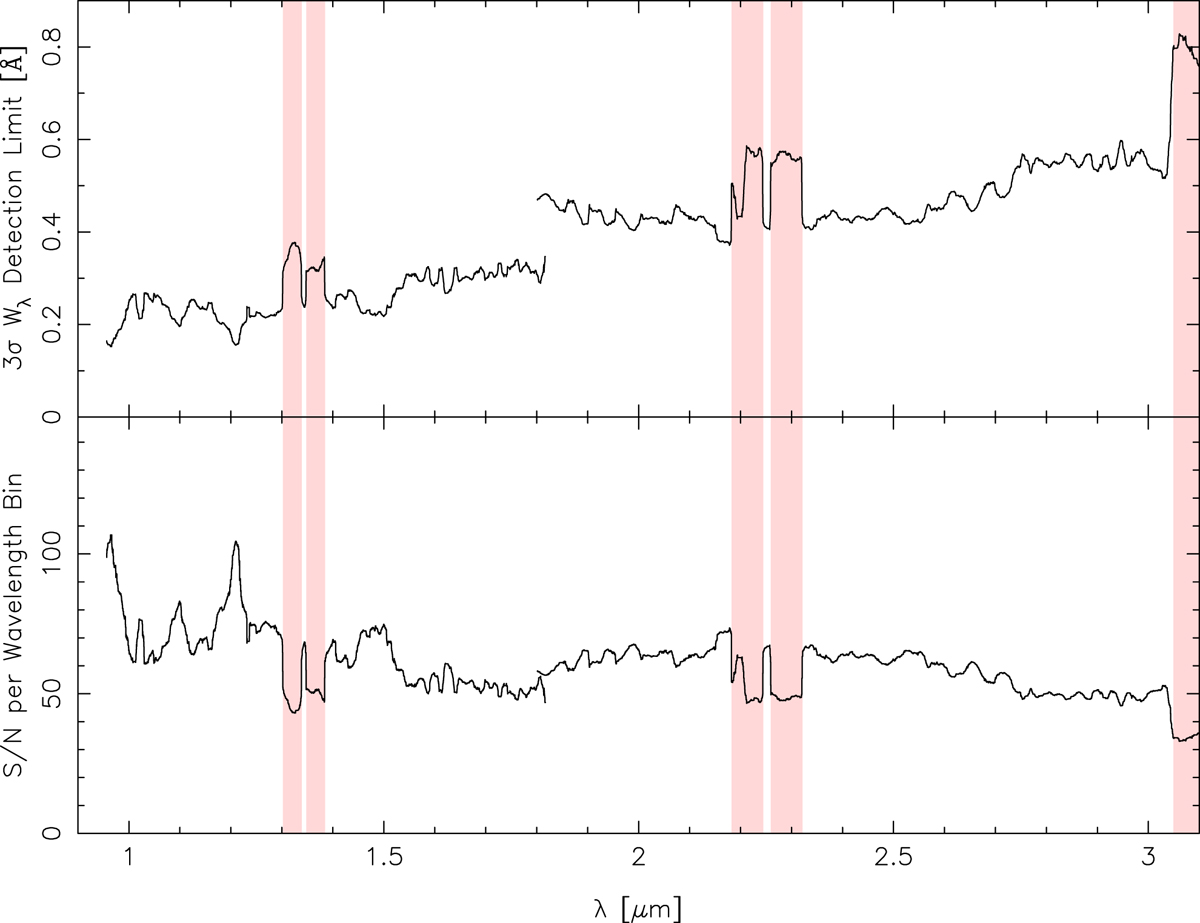
Lower panel: signal-to-noise ratio per wavelength bin as a function of wavelength for the combined Band I and Band II spectra of VDES J0020–3653. The regions of reduced total exposure caused by the detector gap are shown as shaded. Upper panel: corresponding anticipated three sigma narrow absorption line equivalent width detection limit as a function of wavelength.
Current usage metrics show cumulative count of Article Views (full-text article views including HTML views, PDF and ePub downloads, according to the available data) and Abstracts Views on Vision4Press platform.
Data correspond to usage on the plateform after 2015. The current usage metrics is available 48-96 hours after online publication and is updated daily on week days.
Initial download of the metrics may take a while.