Fig. 13.
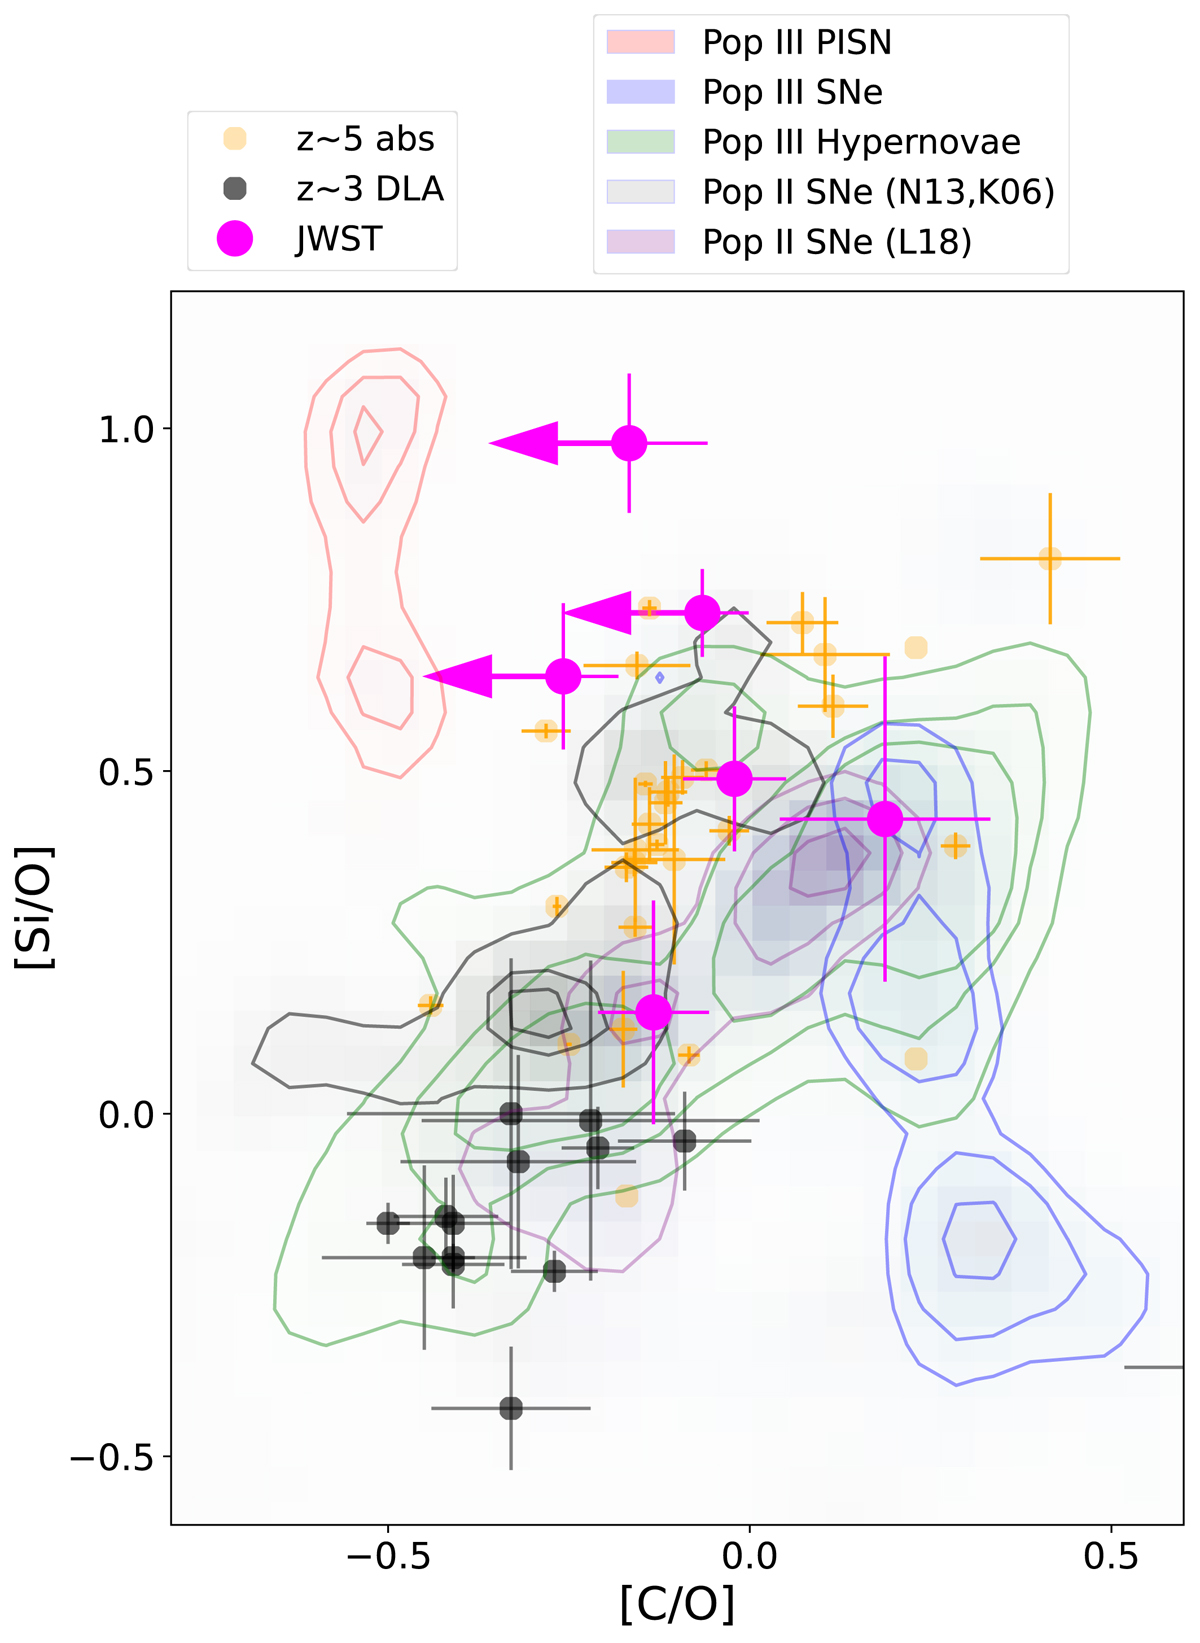
Download original image
Abundance ratios of [Si/O] versus [C/O]. The background coloured map with contours illustrates the metal yields from different stellar explosions coloured as follows: red region: Pop III Pair-instability Supernovae (PISN); green: Pop III Hypernovae; blue: Pop III Core-collapse Supernovae; grey and purple: Pop II Supernovae. Yields from the different stellar populations are scaled assuming a Salpeter IMF. The magenta circles illustrate that the NIRSpec absorption systems listed in Table 10 have values of [Si/O] similar to Pop III models, although some overlap with the yields of a single 15 M⊙ Pop II star. Other intervening absorption-line systems at 4.5 < zabs < 6 (Becker et al. 2019; Cooper et al. 2019; orange circles) fall in the same region of the abundance pattern space, whereas the grey circles representing very metal-poor damped Lyα absorbers at zabs ∼ 3 (Cooke et al. 2011, 2017; Welsh et al. 2019) are also consistent with enrichment of Pop II core collapse SNe (Kobayashi et al. 2006; Nomoto et al. 2013; Limongi & Chieffi 2018, annotated as K06, N13, and L18).
Current usage metrics show cumulative count of Article Views (full-text article views including HTML views, PDF and ePub downloads, according to the available data) and Abstracts Views on Vision4Press platform.
Data correspond to usage on the plateform after 2015. The current usage metrics is available 48-96 hours after online publication and is updated daily on week days.
Initial download of the metrics may take a while.