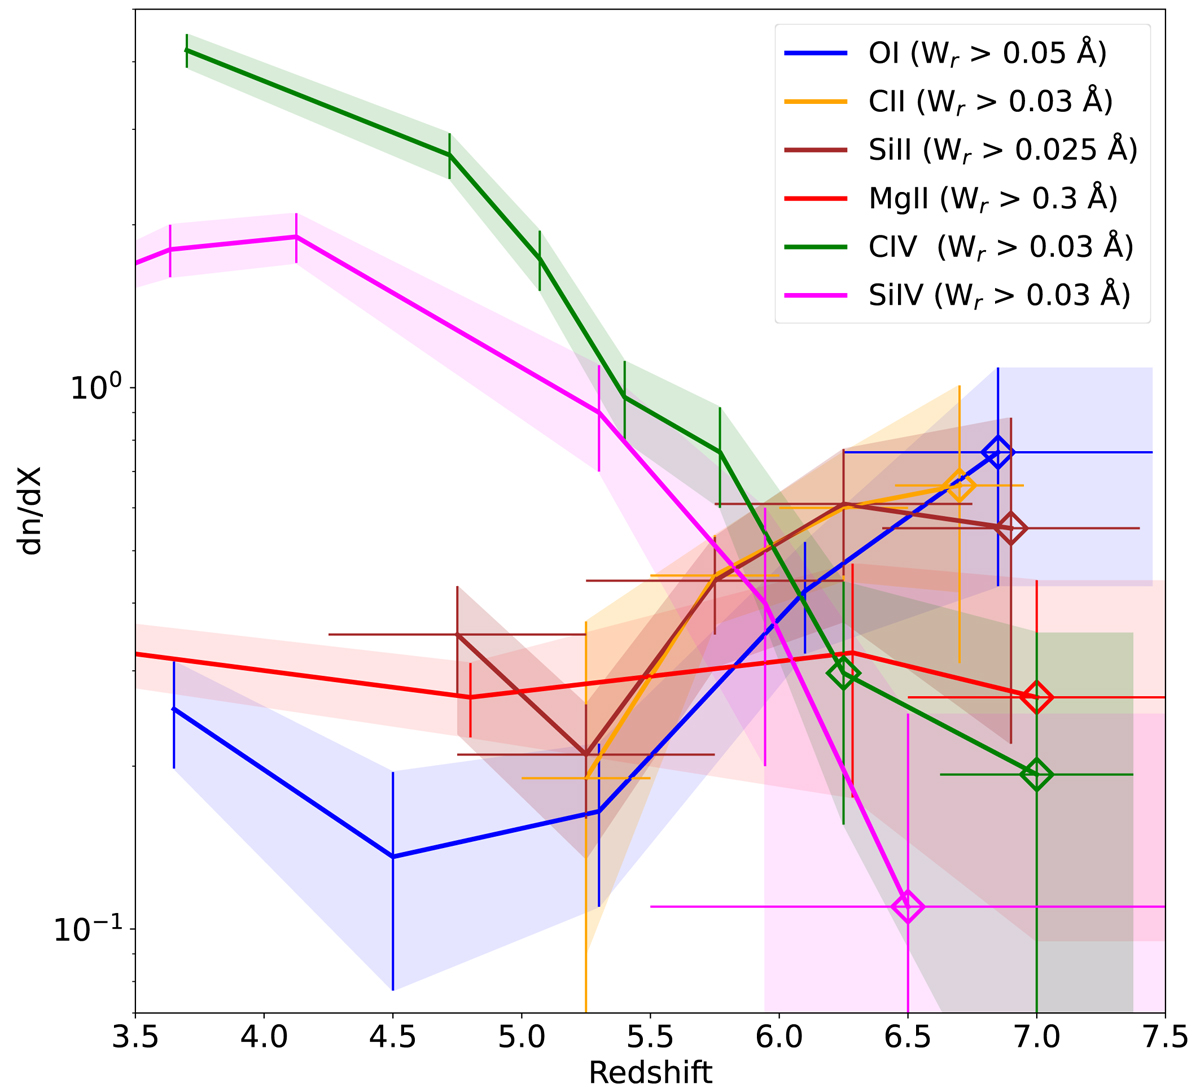
Fig. 12.
Download original image
Comparison of the redshift evolution of the line densities of O Iλ1302, C IIλ1334, Si IIλ1526, Mg IIλ2796, C IVλ1548, and Si IVλ1393. The highest redshift data points for each of the coloured curves represent the NIRSpec analyses in this work, extending from the lower-redshift line densities from O I (Becker et al. 2019), Si II and C II from the catalogue in Davies et al. (2023b), C IV (D’Odorico et al. 2022; Davies et al. 2023a), Si IV (D’Odorico et al. 2022), and Mg II (Chen et al. 2017).
Current usage metrics show cumulative count of Article Views (full-text article views including HTML views, PDF and ePub downloads, according to the available data) and Abstracts Views on Vision4Press platform.
Data correspond to usage on the plateform after 2015. The current usage metrics is available 48-96 hours after online publication and is updated daily on week days.
Initial download of the metrics may take a while.