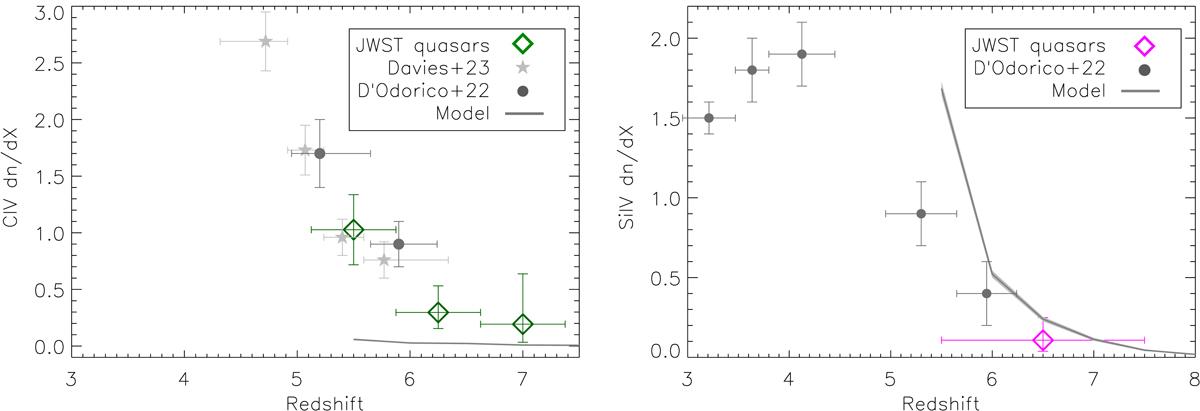
Fig. 11.
Download original image
Line densities of high-ionisation lines. The left hand panels shows the C IV absorption line densities with Wr > 0.05 Å. The C IV line densities at the highest redshifts from the E-XQR-30 survey (D’Odorico et al. 2022) are illustrated for comparison. The same E-XQR-30 data set was analysed in Davies et al. (2023a) and has been corrected for incompleteness. The right hand panel shows Si IV absorption line densities. The Si IV line densities for systems with Wr > 0.03 Å from D’Odorico et al. (2022) are illustrated for comparison.
Current usage metrics show cumulative count of Article Views (full-text article views including HTML views, PDF and ePub downloads, according to the available data) and Abstracts Views on Vision4Press platform.
Data correspond to usage on the plateform after 2015. The current usage metrics is available 48-96 hours after online publication and is updated daily on week days.
Initial download of the metrics may take a while.