Fig. 1.
Download original image
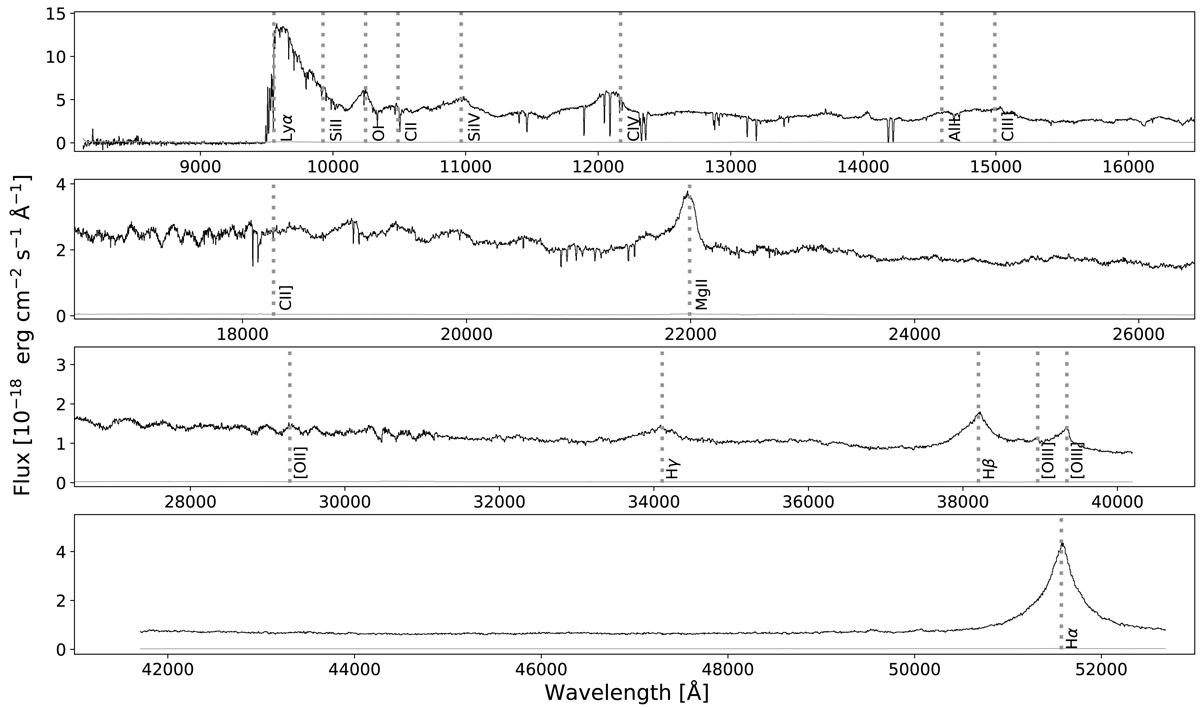
NIRSpec fixed slit (λ < 31 160 Å) and extracted 1D spectrum from the Band III data (λ > 31 160 Å) of VDES J0020–3653. The modulation of the flux, which is particularly pronounced around ∼18 000 and ∼30 000 Å here and also the other quasar spectra, is caused by the coarse sampling of the spectrum described in Sect. 2. The associated error spectrum is shown in grey. With the very high S/N ratio of the spectrum, the error spectrum appears virtually at the zero-flux level.
Current usage metrics show cumulative count of Article Views (full-text article views including HTML views, PDF and ePub downloads, according to the available data) and Abstracts Views on Vision4Press platform.
Data correspond to usage on the plateform after 2015. The current usage metrics is available 48-96 hours after online publication and is updated daily on week days.
Initial download of the metrics may take a while.