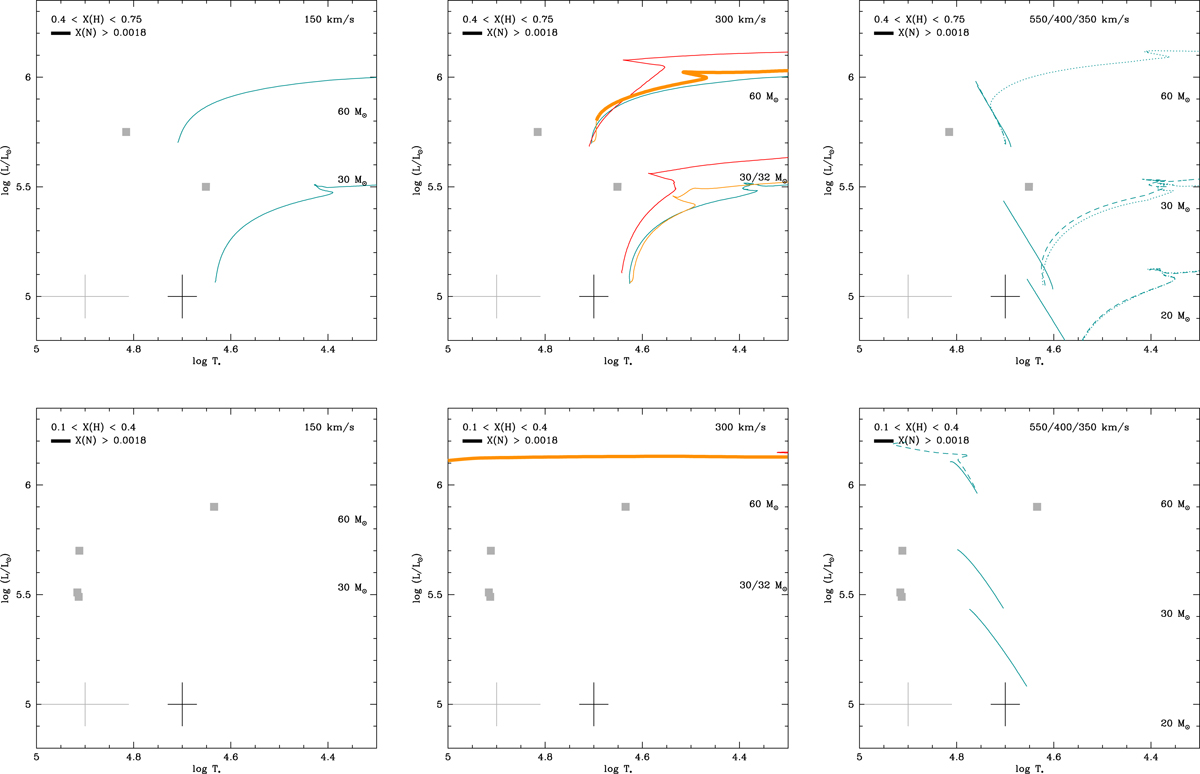
Fig. 8.
Download original image
Same as Fig. 7 but for the SMC. In the right panels the dotted and dashed lines are tracks for initial rotational velocities of 350 and 400 km s−1, respectively. No tracks populate the part of the HRD shown in the bottom left panel. The red tracks are from Georgy et al. (2013). The bold part of the tracks is for a nitrogen mass fraction of greater than 0.0018.
Current usage metrics show cumulative count of Article Views (full-text article views including HTML views, PDF and ePub downloads, according to the available data) and Abstracts Views on Vision4Press platform.
Data correspond to usage on the plateform after 2015. The current usage metrics is available 48-96 hours after online publication and is updated daily on week days.
Initial download of the metrics may take a while.