Fig. 6.
Download original image
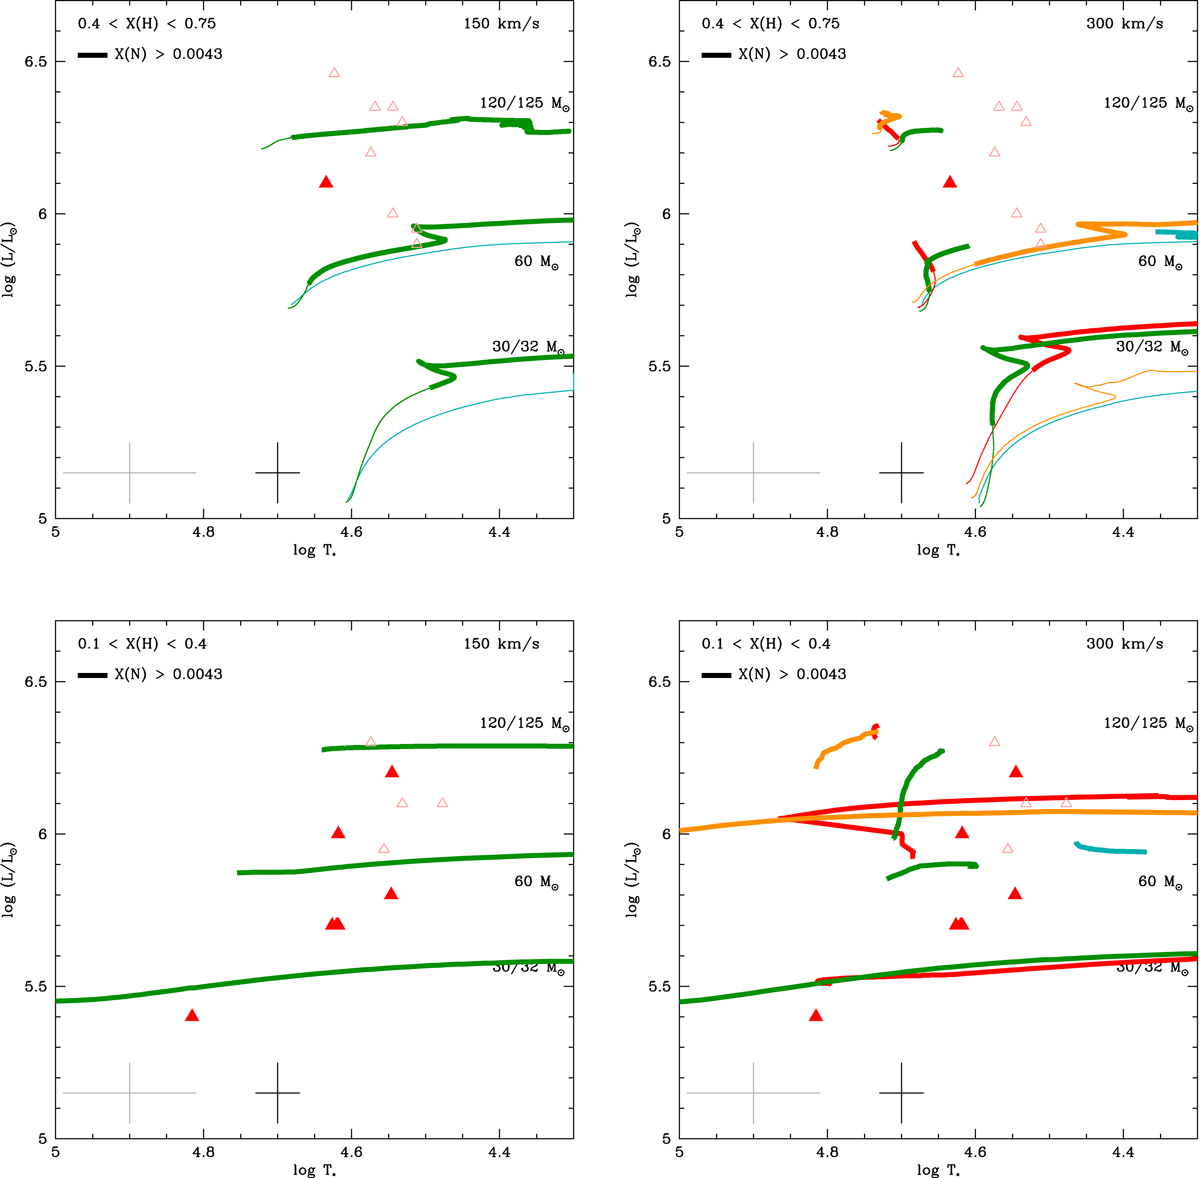
HR diagram for Galactic stars. The top and bottom panels show stars with a hydrogen mass fraction of greater or smaller than 0.4, respectively. Filled triangles are sources analysed in the present study, while open triangles are literature data: WNh stars in the Arches cluster (Martins et al. 2008) and NGC3603-B (Crowther et al. 2010). Evolutionary tracks shown in red, green, cyan, and orange are from Ekström et al. (2012), Limongi & Chieffi (2018), Brott et al. (2011), and Grasha et al. (2021), respectively. The left and right panels show tracks with initial velocities of 150 and 300 km s−1, respectively. In each panel, the range of hydrogen mass fraction is the same for the tracks and the observed stars. The bold part of the tracks is for a nitrogen mass fraction of greater than 0.0043, as explained in Fig. 5.
Current usage metrics show cumulative count of Article Views (full-text article views including HTML views, PDF and ePub downloads, according to the available data) and Abstracts Views on Vision4Press platform.
Data correspond to usage on the plateform after 2015. The current usage metrics is available 48-96 hours after online publication and is updated daily on week days.
Initial download of the metrics may take a while.