Fig. 5.
Download original image
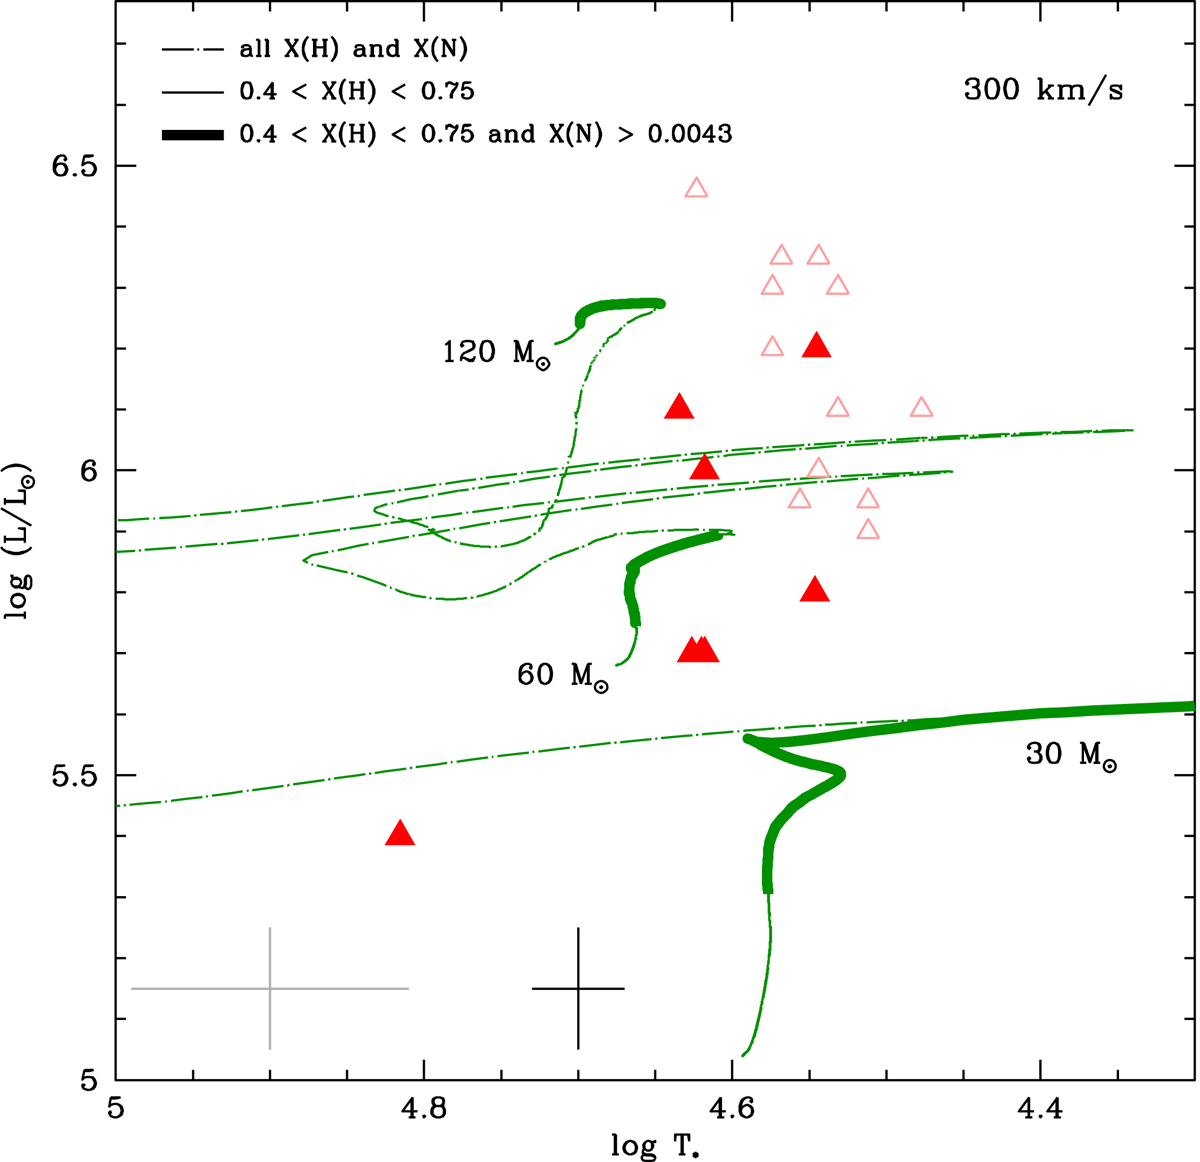
HR diagram for Galactic stars. Tracks are from Limongi & Chieffi (2018) and have an initial rotational velocity of 300 km s−1. The dot-dashed lines show the full tracks. The thin solid lines show the parts for which 0.4 < X < 0.75. The thick solid lines show the parts for which in addition to 0.4 < X < 0.75, X(N) is larger than 0.0043. Symbols are the sample stars (filled triangles) and literature objects (open symbols); see text.
Current usage metrics show cumulative count of Article Views (full-text article views including HTML views, PDF and ePub downloads, according to the available data) and Abstracts Views on Vision4Press platform.
Data correspond to usage on the plateform after 2015. The current usage metrics is available 48-96 hours after online publication and is updated daily on week days.
Initial download of the metrics may take a while.