Open Access
Fig. 3.
Download original image
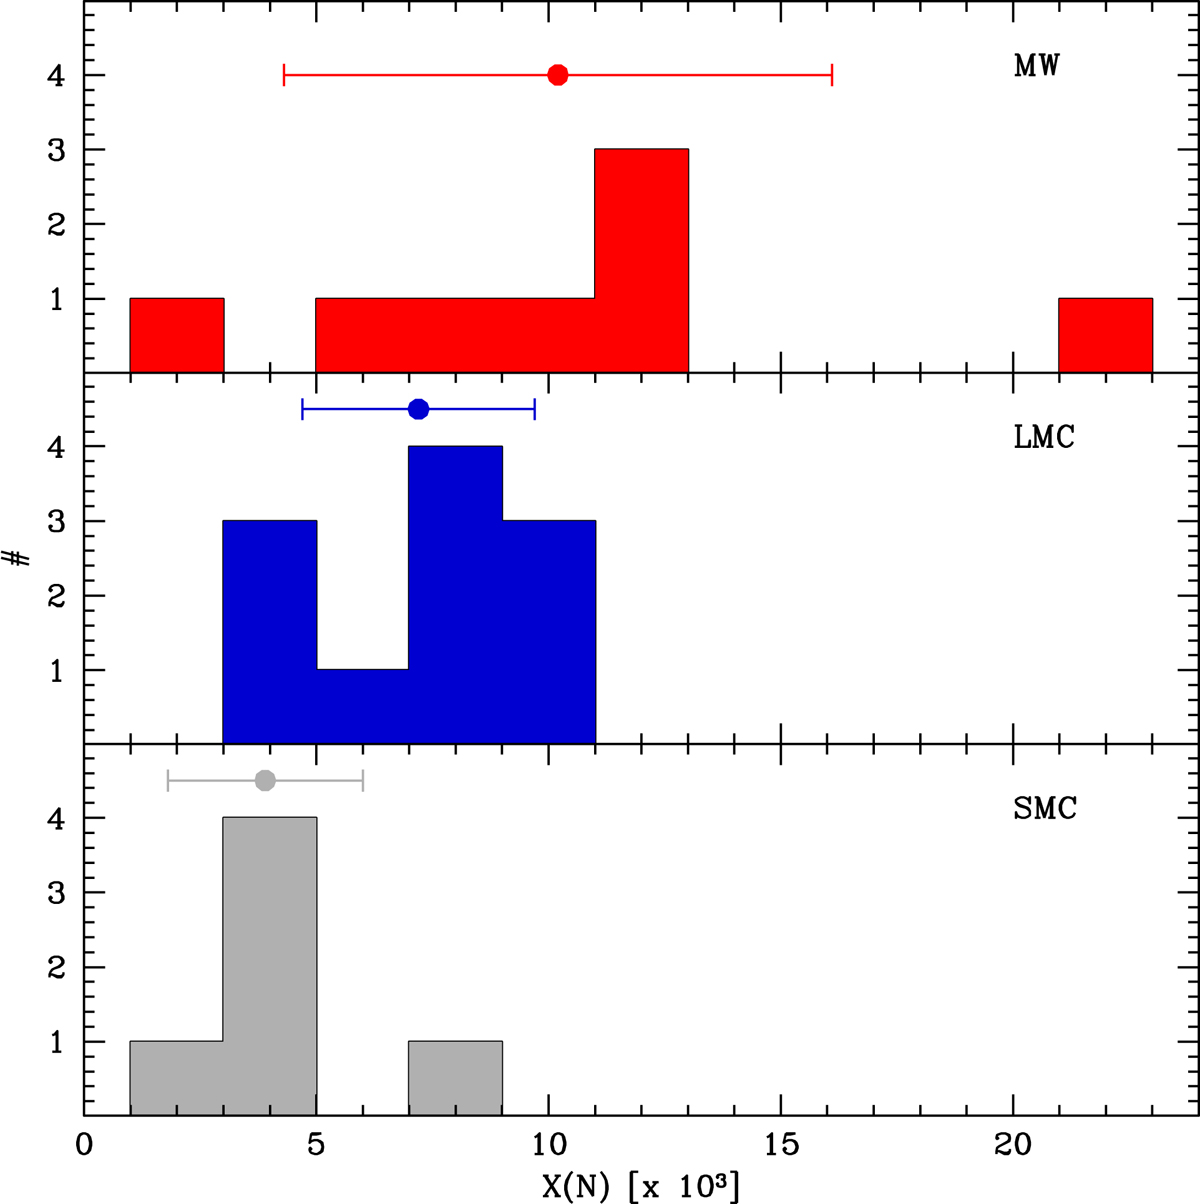
Number distribution of the surface nitrogen mass fraction for the Galaxy, LMC, and SMC (top, middle, and bottom panels, respectively). In each panel, the filled circle indicates the average X(N) and the error bar shows the dispersion.
Current usage metrics show cumulative count of Article Views (full-text article views including HTML views, PDF and ePub downloads, according to the available data) and Abstracts Views on Vision4Press platform.
Data correspond to usage on the plateform after 2015. The current usage metrics is available 48-96 hours after online publication and is updated daily on week days.
Initial download of the metrics may take a while.