Open Access
Fig. D.2
Download original image
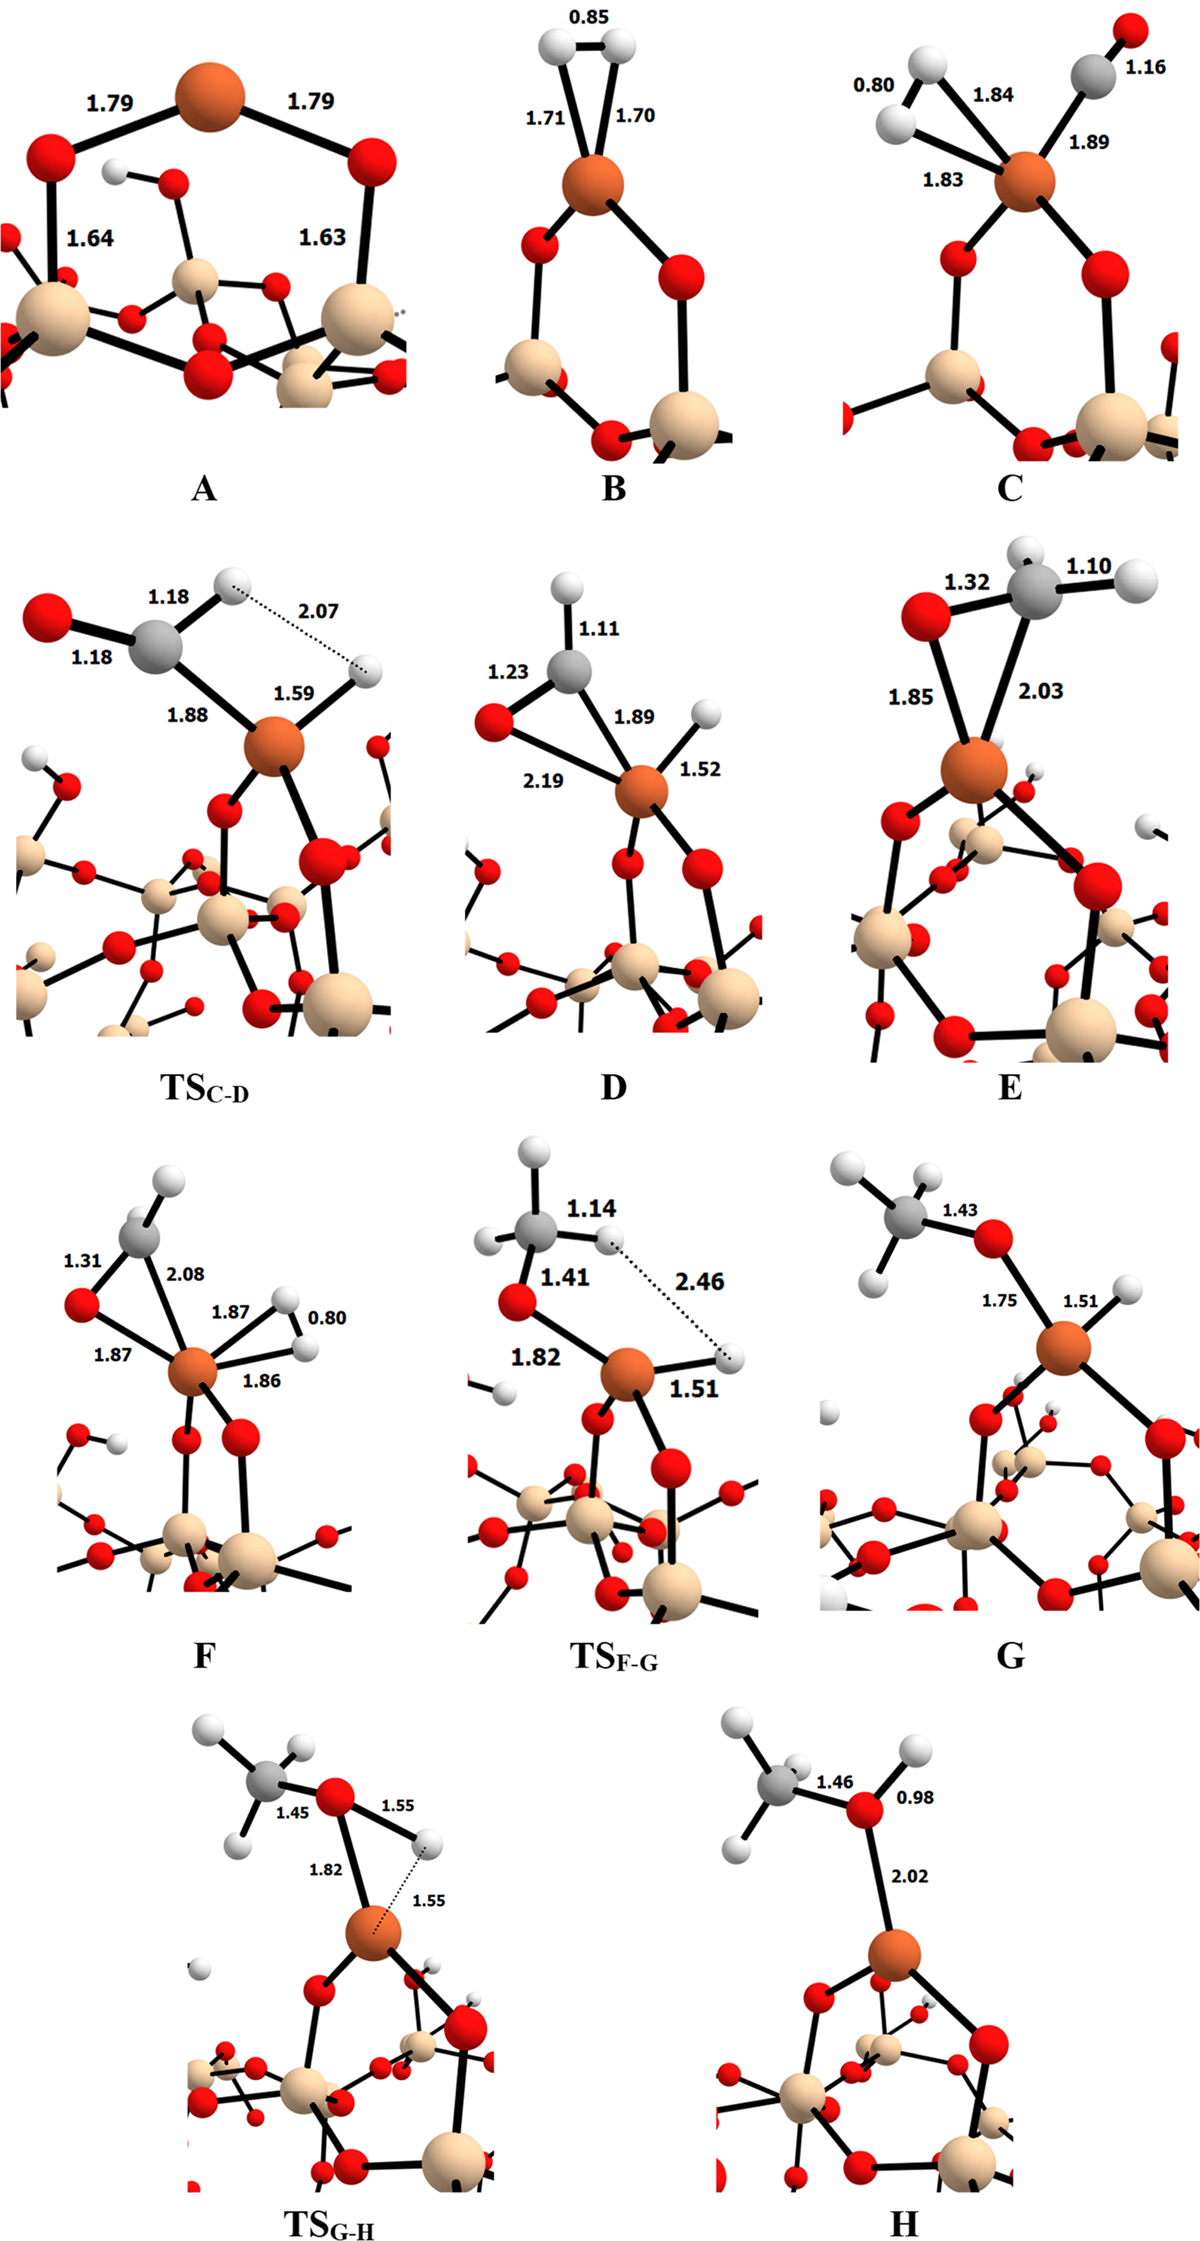
Optimised geometries for the local minima and transition states for the Fe2+ @SiO2 reaction process. Relevant distances depicted in angstroms Å. Colour-coding: white, H atoms; grey, C atoms; red O atoms; beige, Si atoms; and orange Fe atoms.
Current usage metrics show cumulative count of Article Views (full-text article views including HTML views, PDF and ePub downloads, according to the available data) and Abstracts Views on Vision4Press platform.
Data correspond to usage on the plateform after 2015. The current usage metrics is available 48-96 hours after online publication and is updated daily on week days.
Initial download of the metrics may take a while.