Fig. 5
Download original image
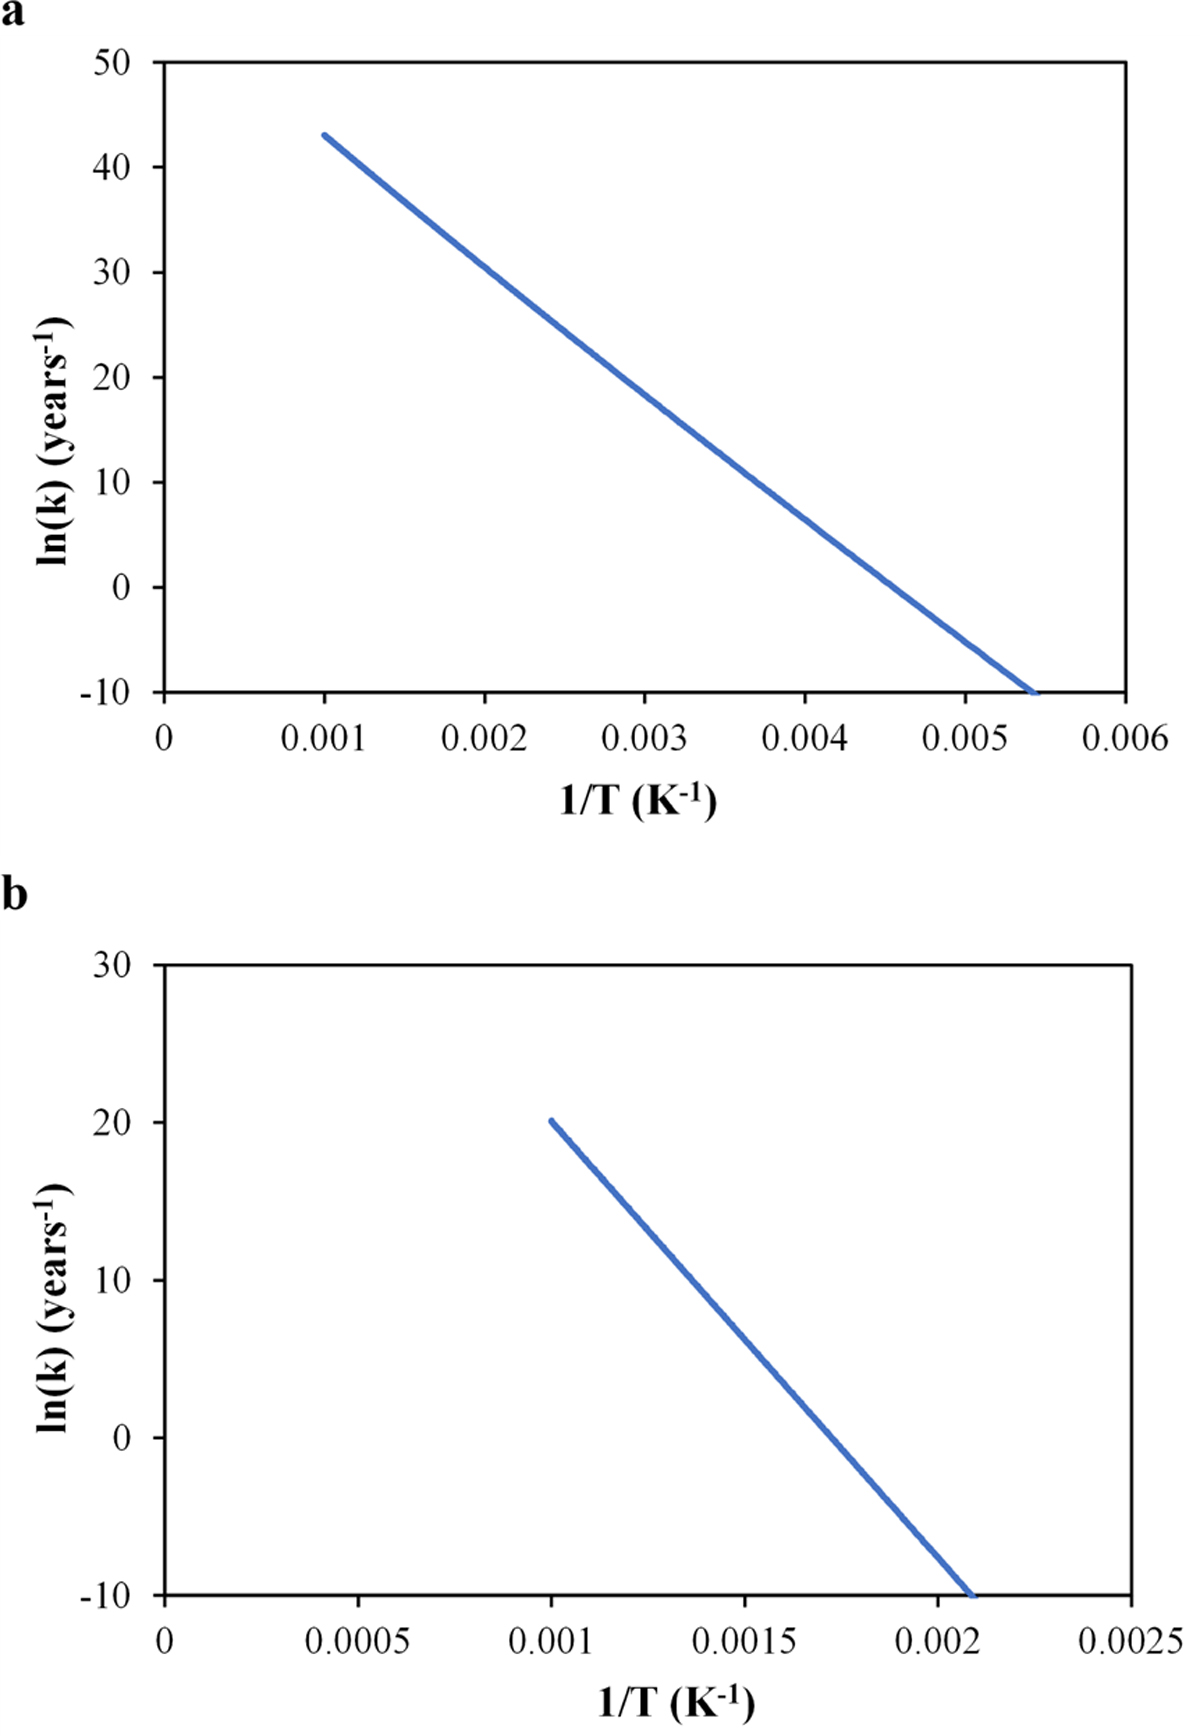
Arrhenius plots for: (a) the free energy barrier associated with the TSC-D structure on the Fe0 @SiO2 catalyst, and (b) the free energy barrier associated with the TSc-d structure on the Fe2+@SiO2 catalyst. Plots including the fits and correlation coefficients, and all values represented in the plots are collected in Figs. F.1 and F.2 and Tables F.1–F.4 and F.5–F.7.
Current usage metrics show cumulative count of Article Views (full-text article views including HTML views, PDF and ePub downloads, according to the available data) and Abstracts Views on Vision4Press platform.
Data correspond to usage on the plateform after 2015. The current usage metrics is available 48-96 hours after online publication and is updated daily on week days.
Initial download of the metrics may take a while.