Fig. 3
Download original image
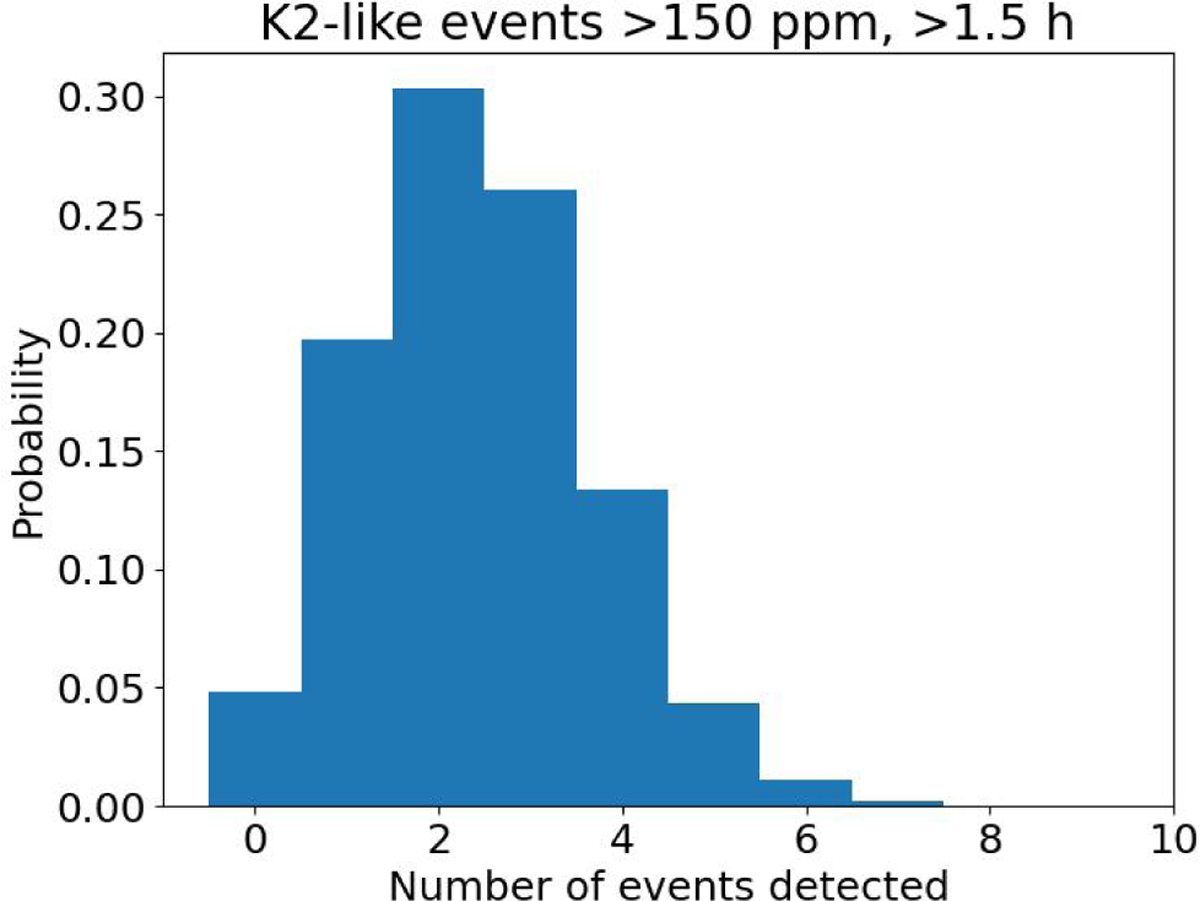
Histogram of the number of events detected in our observation window, under the assumptions that they share the properties of the uones detected in Rappaport et al. (2019a). From the number of times no events were detected, we estimate the probability of having missed all events in our data set due to our limited observing time to be 4.8%. In this plot, only the K2 features with depths larger than 150 ppm and durations longer than 1.5 h have been considered.
Current usage metrics show cumulative count of Article Views (full-text article views including HTML views, PDF and ePub downloads, according to the available data) and Abstracts Views on Vision4Press platform.
Data correspond to usage on the plateform after 2015. The current usage metrics is available 48-96 hours after online publication and is updated daily on week days.
Initial download of the metrics may take a while.