Fig. 2
Download original image
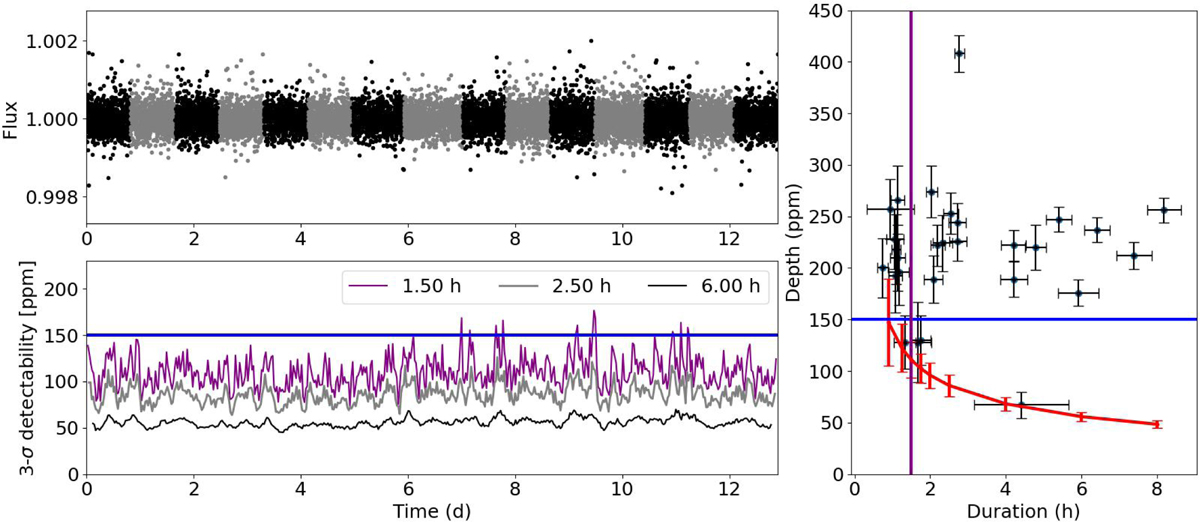
Establishing the transit-like detectability limits of the CHEOPS observations. The upper-left panel shows the 15 CHEOPS visits stitched together with the original 1 min cadence. From this curve, we estimate the 3-σ detectability levels for transits of different durations, as shown in the lower-left panel for a sample of three transit durations. The panel on the right shows the duration and depth of the features reported in the original K2 data (black dots with error bars) and the mean value of the 3-σ detectability for different transit durations (red dots and connecting lines). The error bars of the red dots represent the standard deviation of the 3-σ detectability curves for each sampled duration. The blue and purple lines represent our selected thresholds for the depth (150 ppm) and duration (1.5 h) of the events that would have been clearly detected in our data. The upper-right quadrant of this panel contains the 16 K2 events that are used to estimate the observation window of our data and to produce the histogram shown in Fig. 3.
Current usage metrics show cumulative count of Article Views (full-text article views including HTML views, PDF and ePub downloads, according to the available data) and Abstracts Views on Vision4Press platform.
Data correspond to usage on the plateform after 2015. The current usage metrics is available 48-96 hours after online publication and is updated daily on week days.
Initial download of the metrics may take a while.