Fig. 7
Download original image
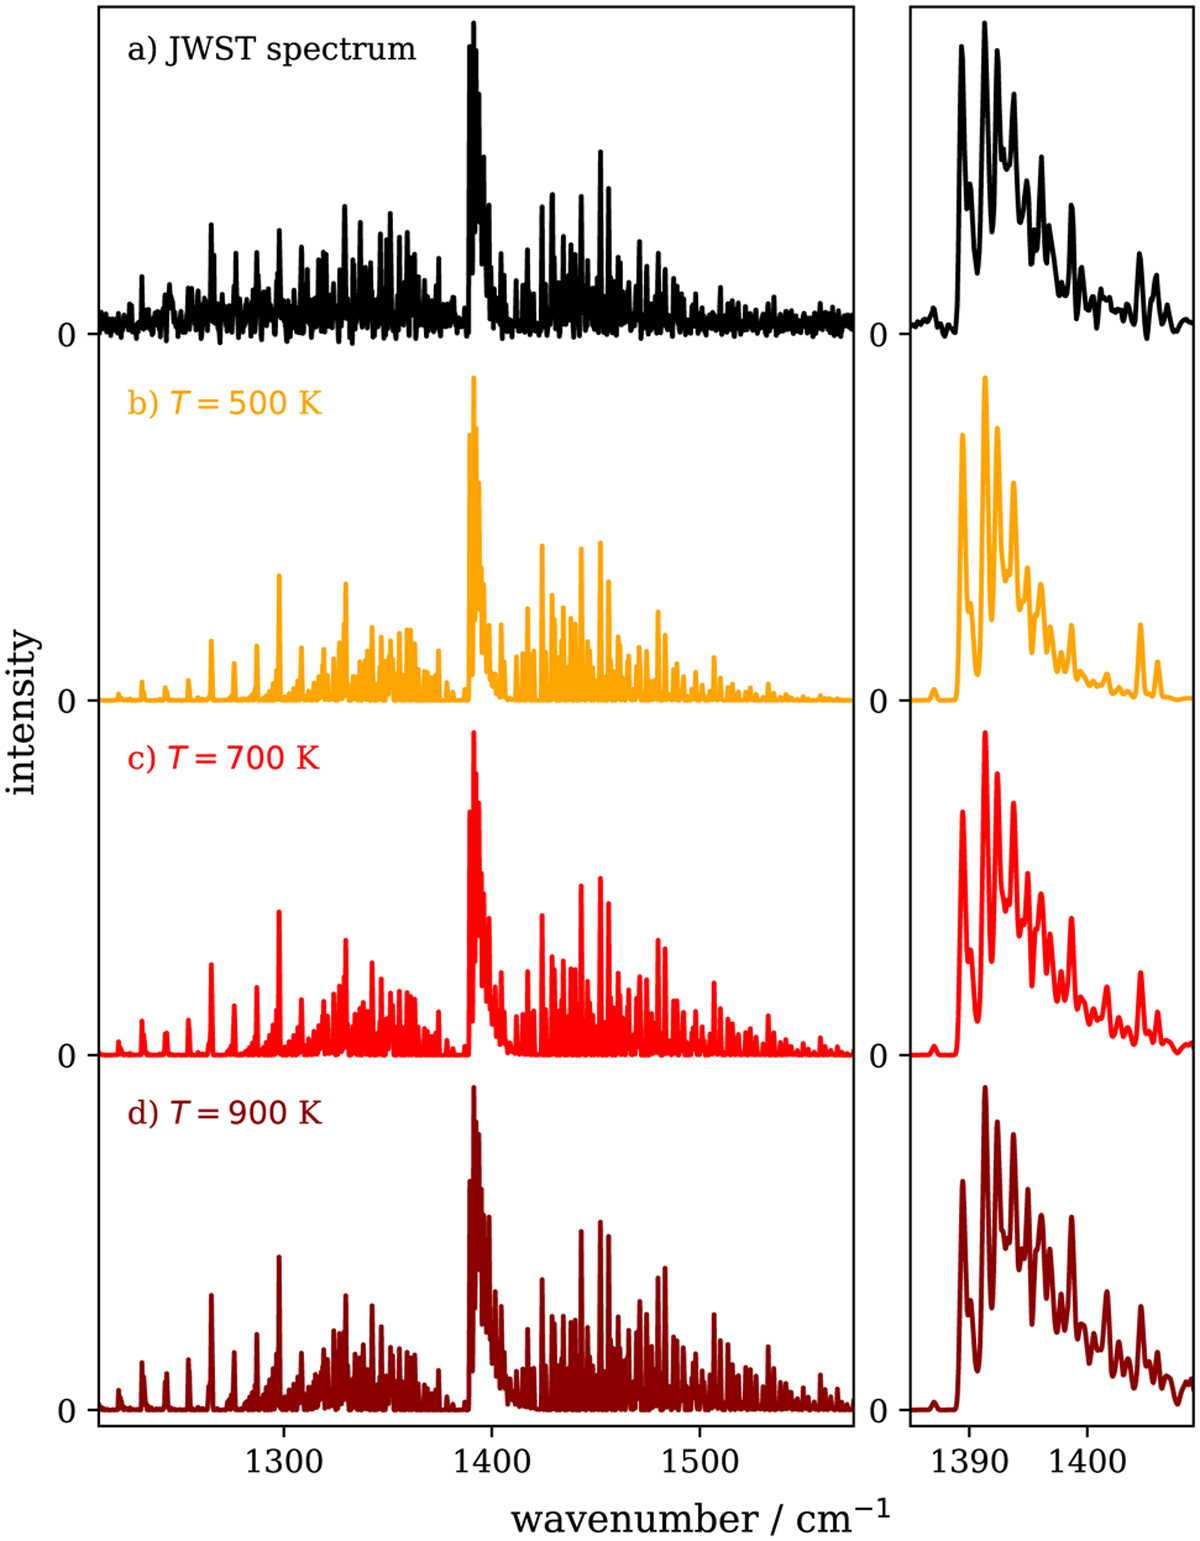
Comparison of the astronomical spectrum (panel a) and simulations of the ![]() dyad (other panels) of
dyad (other panels) of ![]() (
(![]() electronic state) for different rotational temperatures (500 K, 700 K, and 900 K in panels b, c, and d, respectively). A zoom into the Q-branch is presented on the right-hand side of the figure. All simulations have been performed using the best-fit parameters (Table 1) and convolved with a Gaussian line shape (FWHM = 0.4 cm−1).
electronic state) for different rotational temperatures (500 K, 700 K, and 900 K in panels b, c, and d, respectively). A zoom into the Q-branch is presented on the right-hand side of the figure. All simulations have been performed using the best-fit parameters (Table 1) and convolved with a Gaussian line shape (FWHM = 0.4 cm−1).
Current usage metrics show cumulative count of Article Views (full-text article views including HTML views, PDF and ePub downloads, according to the available data) and Abstracts Views on Vision4Press platform.
Data correspond to usage on the plateform after 2015. The current usage metrics is available 48-96 hours after online publication and is updated daily on week days.
Initial download of the metrics may take a while.