Fig. 6
Download original image
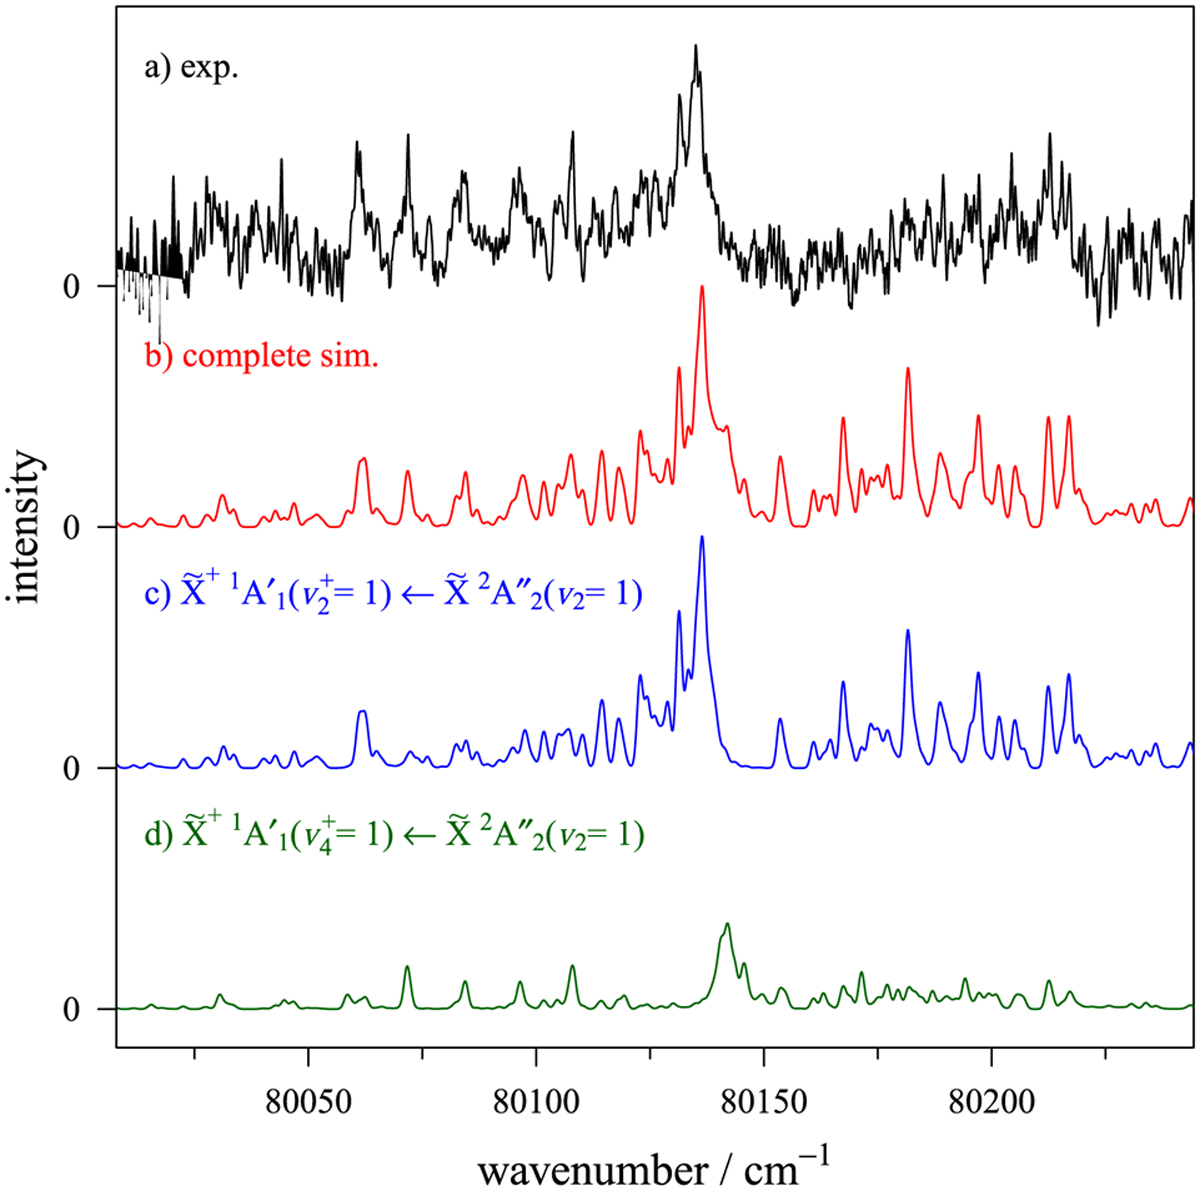
Rotationally resolved photoelectron spectrum of the methyl radical in the vicinity of the ![]() and
and ![]() photoionizing transitions. The black curve (panel a) is the experimental spectrum, the red one (panel b) the complete simulation and the blue and green ones (panels c and d) the separated simulations of the ionizing transitions to
photoionizing transitions. The black curve (panel a) is the experimental spectrum, the red one (panel b) the complete simulation and the blue and green ones (panels c and d) the separated simulations of the ionizing transitions to ![]() and
and ![]() , respectively. All simulations have been performed at 250 K and convolved with a Gaussian line shape (FWHM = 1.5 cm−1).
, respectively. All simulations have been performed at 250 K and convolved with a Gaussian line shape (FWHM = 1.5 cm−1).
Current usage metrics show cumulative count of Article Views (full-text article views including HTML views, PDF and ePub downloads, according to the available data) and Abstracts Views on Vision4Press platform.
Data correspond to usage on the plateform after 2015. The current usage metrics is available 48-96 hours after online publication and is updated daily on week days.
Initial download of the metrics may take a while.