Fig. 2
Download original image
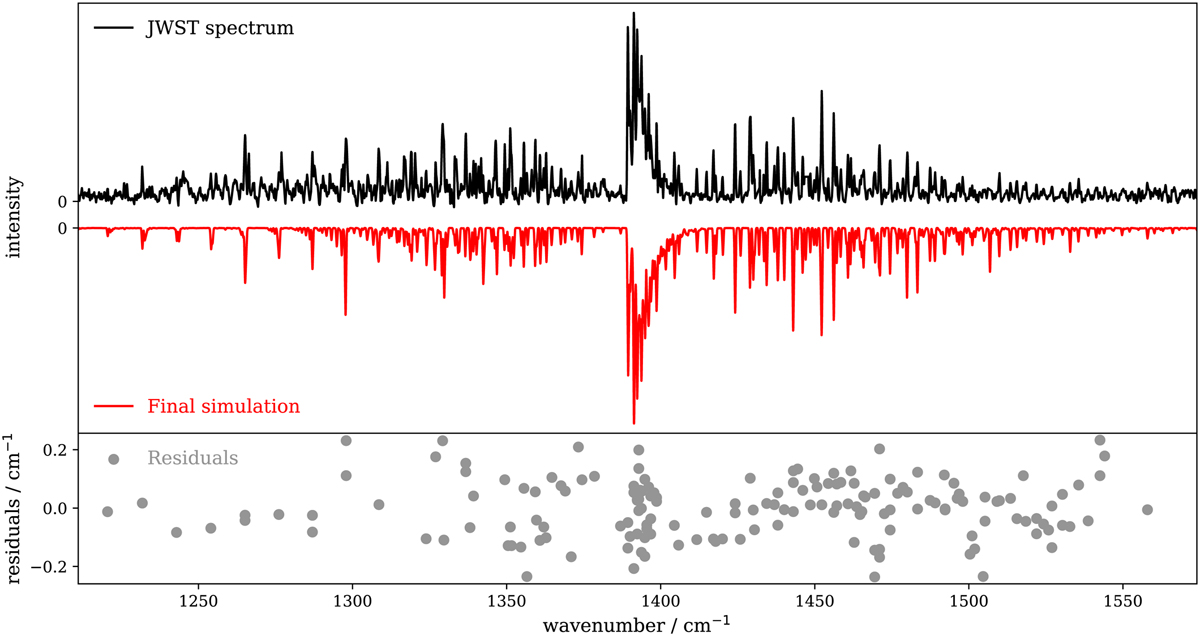
Astronomical emission spectrum recorded by JWST and comparison with simulations of the ![]() dyad of
dyad of ![]() performed using the best-fit parameters (top panel). The simulation has been performed using the same profile parameters as in Fig. 1 (T = 700 K, FWHM = 0.4 cm−1). The wavenumber residuals of the line-by-line fits are plotted in the lower panel of the figure.
performed using the best-fit parameters (top panel). The simulation has been performed using the same profile parameters as in Fig. 1 (T = 700 K, FWHM = 0.4 cm−1). The wavenumber residuals of the line-by-line fits are plotted in the lower panel of the figure.
Current usage metrics show cumulative count of Article Views (full-text article views including HTML views, PDF and ePub downloads, according to the available data) and Abstracts Views on Vision4Press platform.
Data correspond to usage on the plateform after 2015. The current usage metrics is available 48-96 hours after online publication and is updated daily on week days.
Initial download of the metrics may take a while.