Fig. 1
Download original image
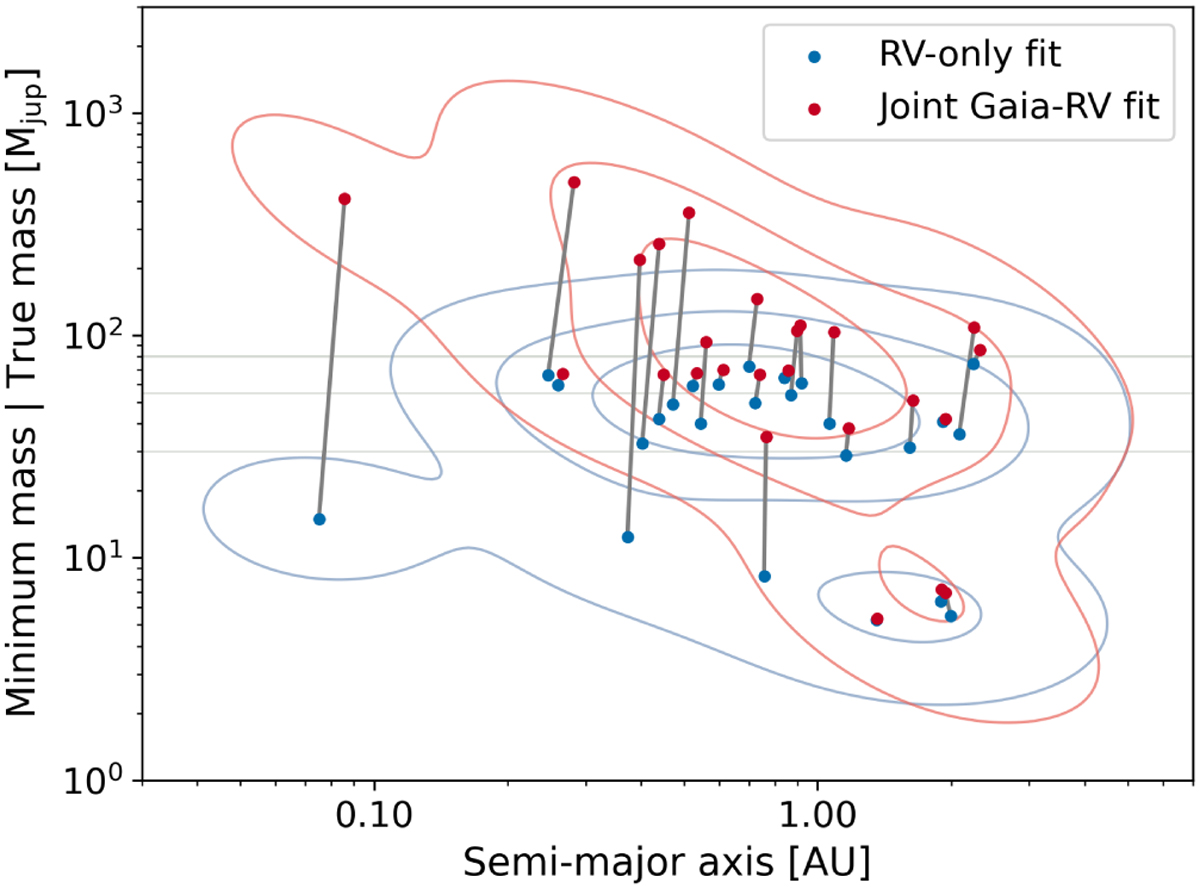
[Minimum/True] mass of the companion and the semi-major axis for the RV-only solutions (blue) and the joint Gaia-RV solution (red). The horizontal solid lines show the 30, 55, and 80 MJup mass limits, respectively. A kernel density estimate (KDE) plot is shown on top for each set of solutions. Only companions with robust solutions are shown, i.e., targets from the first section of Table A.4.
Current usage metrics show cumulative count of Article Views (full-text article views including HTML views, PDF and ePub downloads, according to the available data) and Abstracts Views on Vision4Press platform.
Data correspond to usage on the plateform after 2015. The current usage metrics is available 48-96 hours after online publication and is updated daily on week days.
Initial download of the metrics may take a while.