Open Access
Fig. 2
Download original image
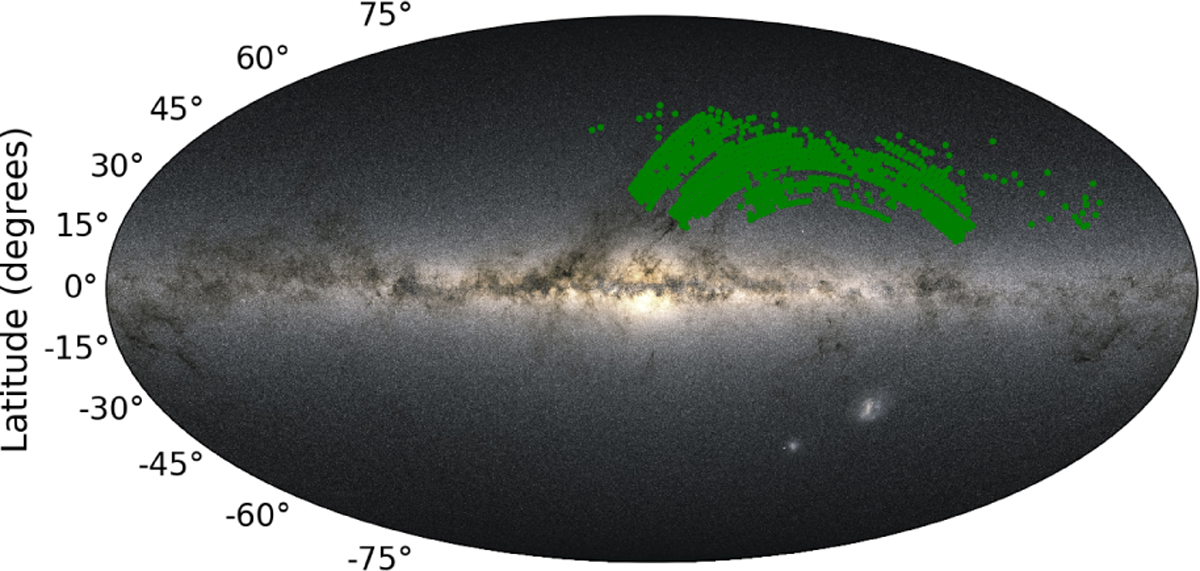
Sky coordinates of the 718 MeerLICHT images (green dots) overlayed on an image of the Galactic Plane. This visualization demonstrates the diverse array of spatial densities covered by our dataset, facilitating a thorough evaluation of our model’s capacity to classify regions with varying degrees of crowdedness.
Current usage metrics show cumulative count of Article Views (full-text article views including HTML views, PDF and ePub downloads, according to the available data) and Abstracts Views on Vision4Press platform.
Data correspond to usage on the plateform after 2015. The current usage metrics is available 48-96 hours after online publication and is updated daily on week days.
Initial download of the metrics may take a while.