Fig. 15
Download original image
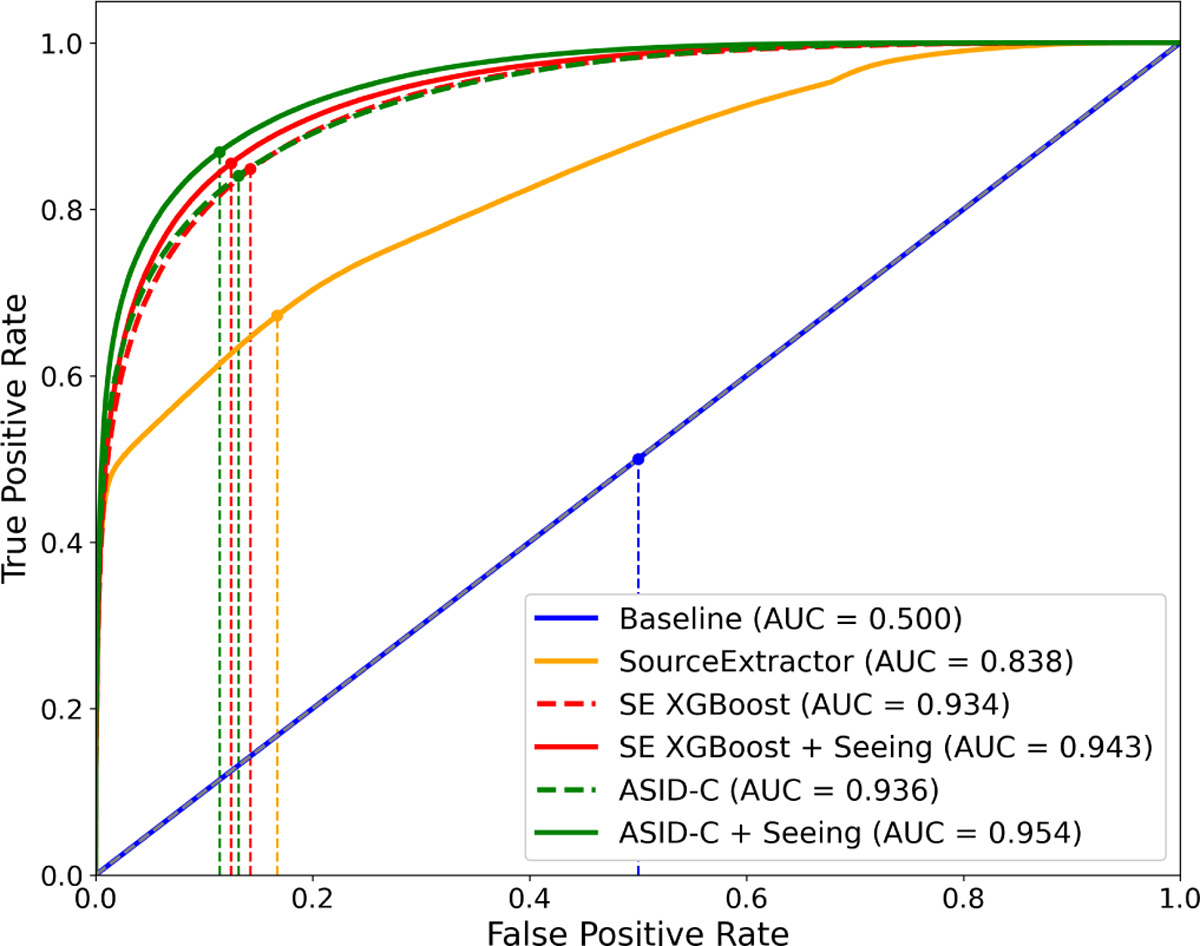
ROC curves and area under the curve (AUC) values for multiple methods, including two variants of ASID-C, two XGBoost models, SourceExtractor, and a Baseline model. Optimal threshold points are indicated on each curve, and vertical dashed lines show the false positive rate at these optimal points. The ASID-C model, when trained with the additional seeing parameter, exhibits the highest overall AUC.
Current usage metrics show cumulative count of Article Views (full-text article views including HTML views, PDF and ePub downloads, according to the available data) and Abstracts Views on Vision4Press platform.
Data correspond to usage on the plateform after 2015. The current usage metrics is available 48-96 hours after online publication and is updated daily on week days.
Initial download of the metrics may take a while.