Open Access
Fig. 12
Download original image
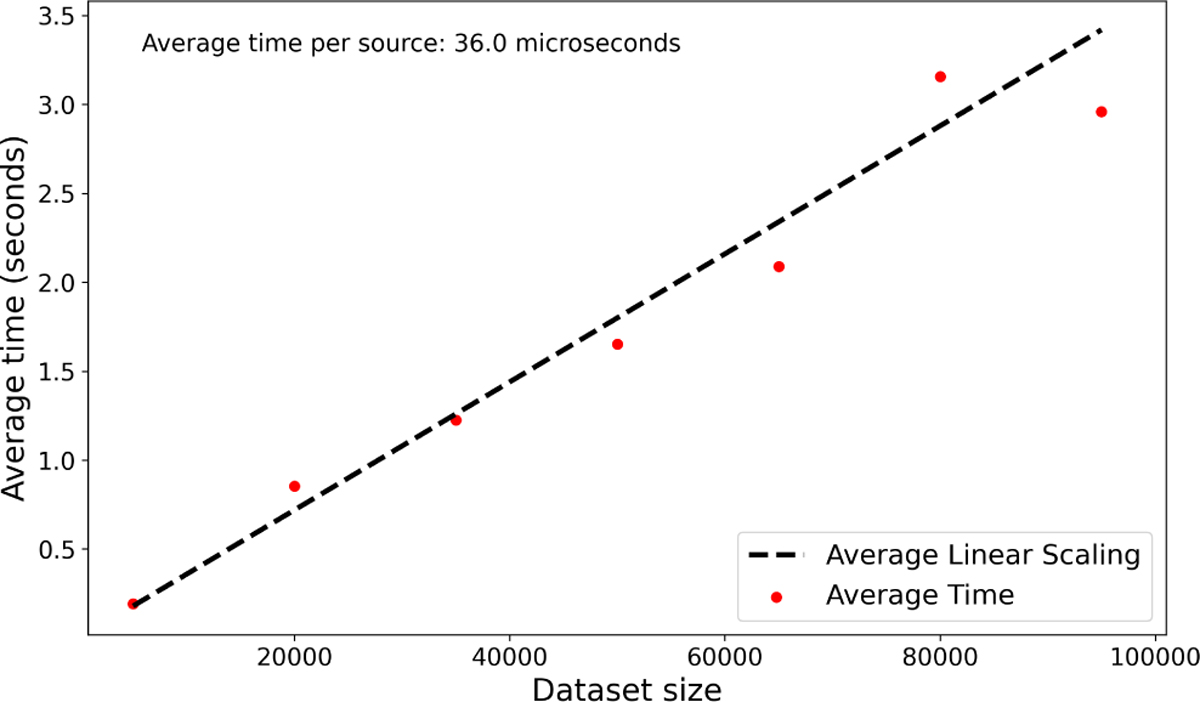
Average time taken by ASID-C to predict on different sizes of datasets. The red dots represent the average time taken per dataset size, and the black dashed line represents the expected time based on linear scaling.
Current usage metrics show cumulative count of Article Views (full-text article views including HTML views, PDF and ePub downloads, according to the available data) and Abstracts Views on Vision4Press platform.
Data correspond to usage on the plateform after 2015. The current usage metrics is available 48-96 hours after online publication and is updated daily on week days.
Initial download of the metrics may take a while.