Fig. 10
Download original image
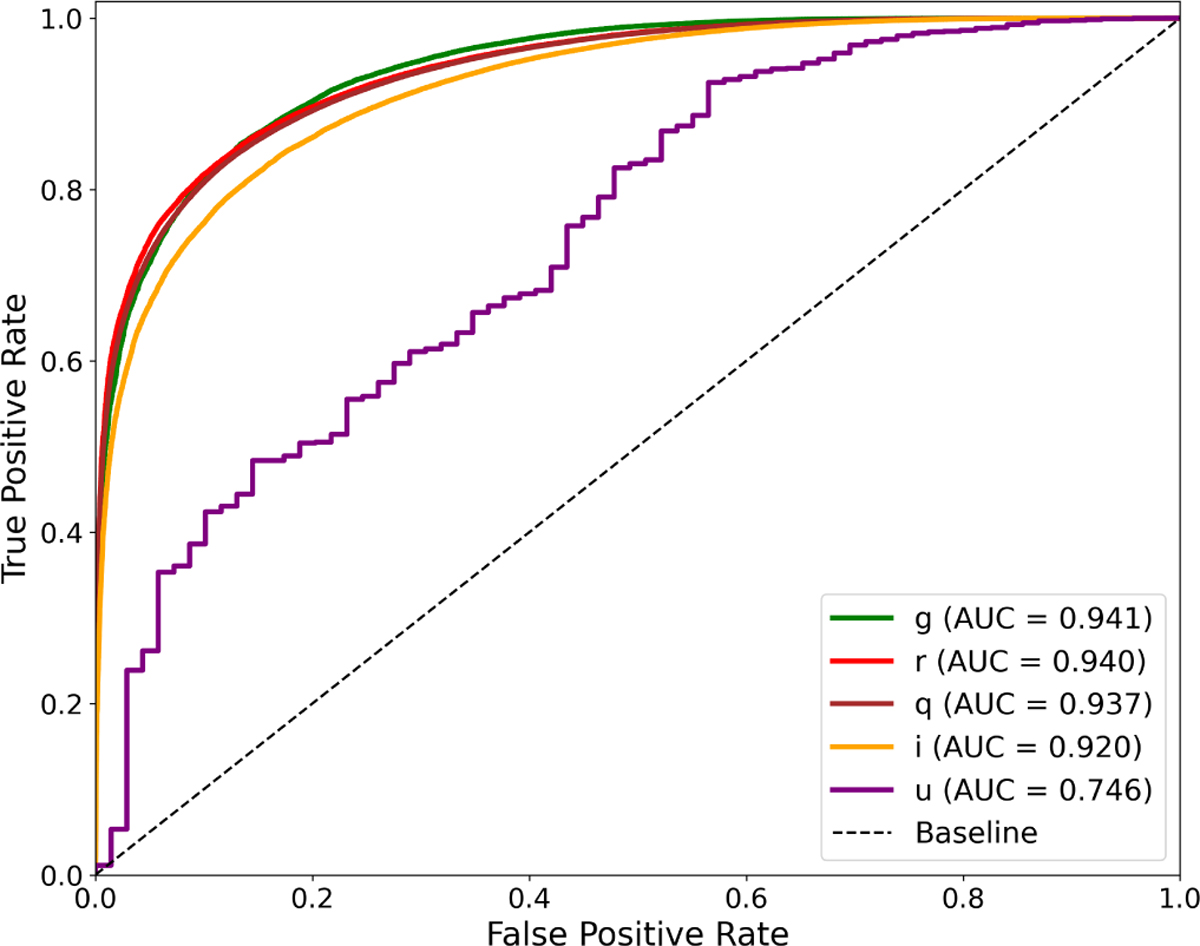
ROC curve of ASID-C across five MeerLICHT bands. The figure shows consistently high ROC-AUC values across most bands. A noticeable performance dip in the u band is observed, likely due to the intrinsic color properties of galaxies. In this band, galaxies often lack features that distinguish them from stars, making classification more challenging.
Current usage metrics show cumulative count of Article Views (full-text article views including HTML views, PDF and ePub downloads, according to the available data) and Abstracts Views on Vision4Press platform.
Data correspond to usage on the plateform after 2015. The current usage metrics is available 48-96 hours after online publication and is updated daily on week days.
Initial download of the metrics may take a while.