Fig. A.1
Download original image
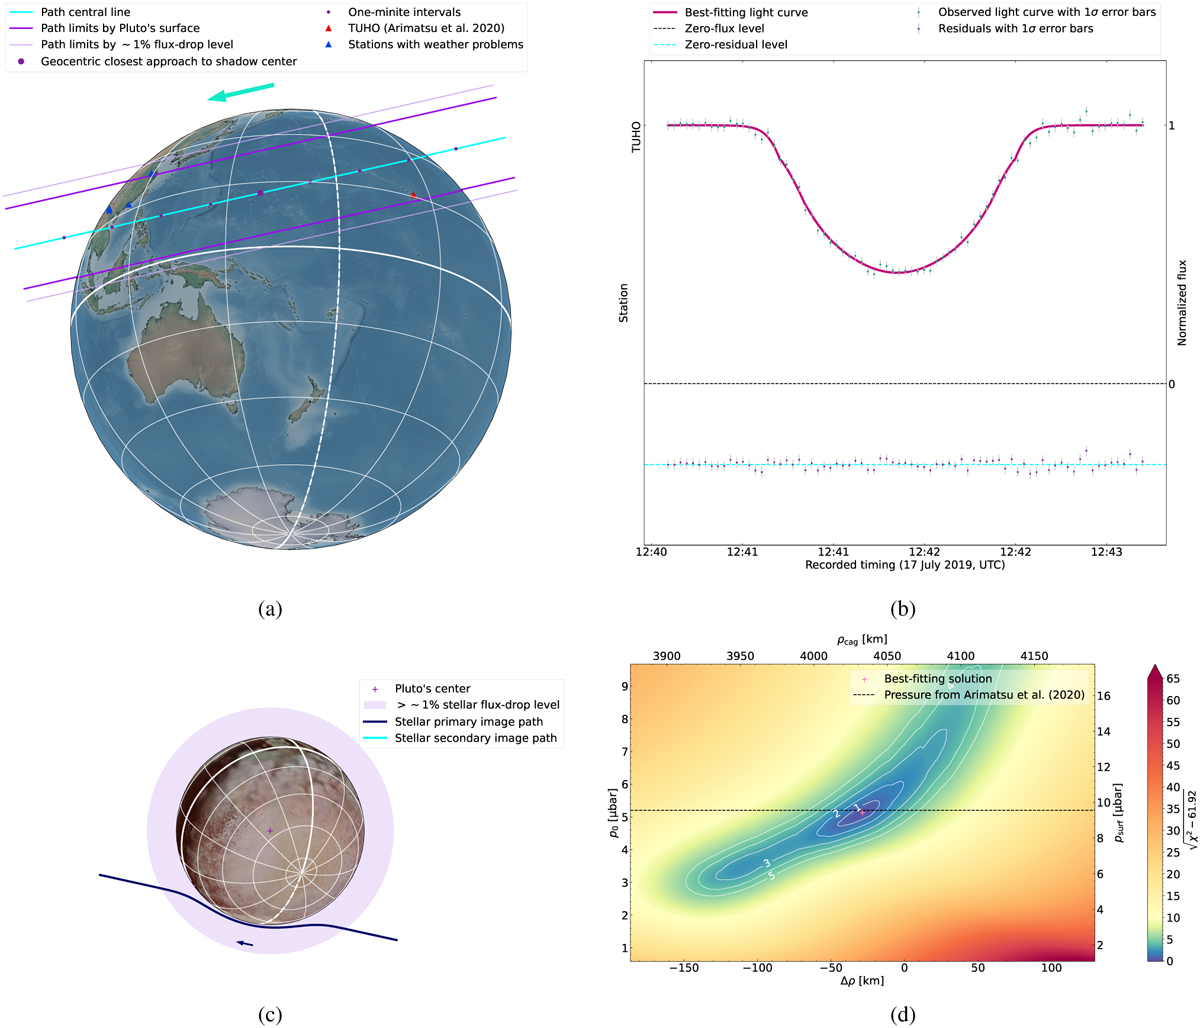
Reanalysis of the 17 July 2019 event based on the TUHO observational data from Figure 1 of Arimatsu et al. (2020) (credit: Arimatsu et al, A&A, 638, L5, 2020, reproduced with permission © ESO). Panel (a): Reconstructed occultation map. Panel (b): Observed and simultaneously fitted light curves. Panel (c): Reconstructed stellar paths seen by TUHO. Panel (d): The χ2 map, where χ2 denotes the goodness-of-fit value using these data. The best-fitting χ2 value per degree of freedom is 0.860.
Current usage metrics show cumulative count of Article Views (full-text article views including HTML views, PDF and ePub downloads, according to the available data) and Abstracts Views on Vision4Press platform.
Data correspond to usage on the plateform after 2015. The current usage metrics is available 48-96 hours after online publication and is updated daily on week days.
Initial download of the metrics may take a while.