Fig. 3
Download original image
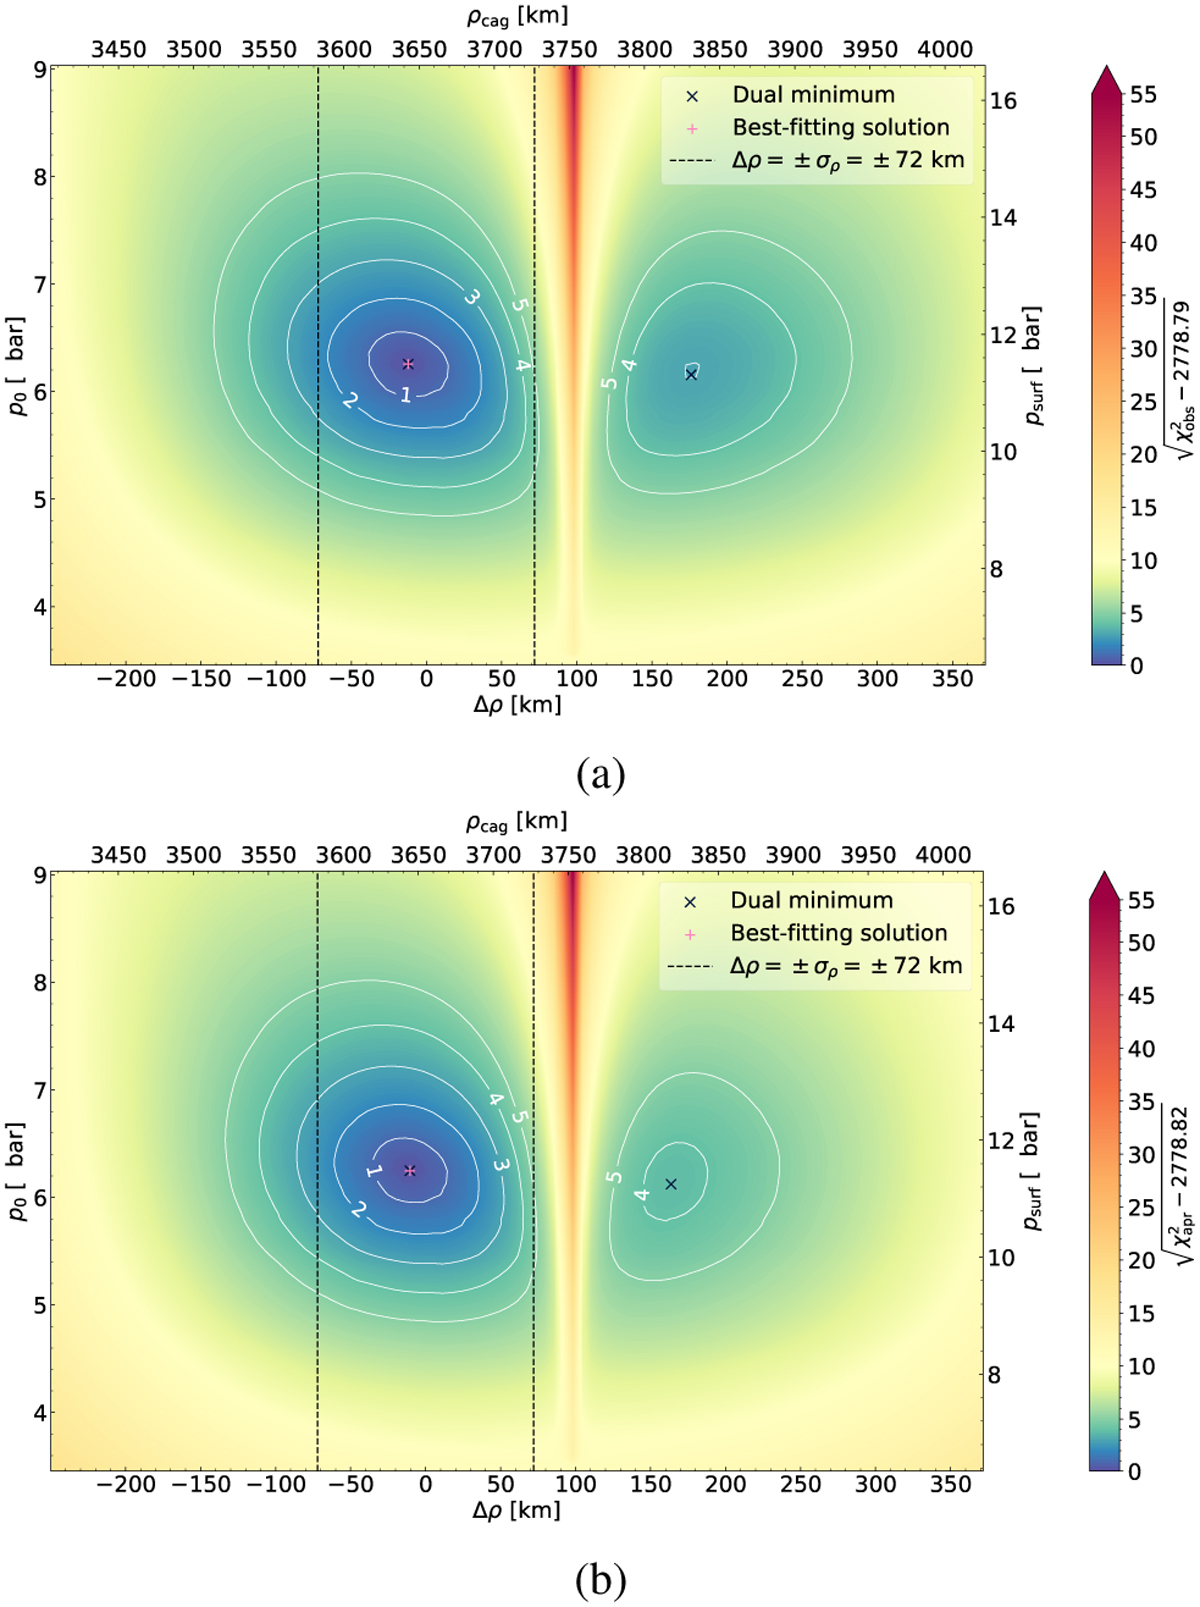
The χ2 maps of the 5 September 2019 event. Panels a and b: The ![]() and
and ![]() maps, respectively. The
maps, respectively. The ![]() denotes the goodness-of-fit only using observational data, while
denotes the goodness-of-fit only using observational data, while ![]() denotes the goodness-of-flt with the additional a priori information represented as the χ2 type value, (Δρ/σρ)2. These maps are used to derive the best-fitting atmospheric pressure p0 at the reference radius r0 of 1215 km and the cross-track correction Δρ to the ephemerides, of which the a priori uncertainty σρ is 72 km. The surface pressure psurf and the geocentric closest approach distance ρcag to the shadow center are obtained by linear transformations of Δρ and p0, respectively. The best-fitting
denotes the goodness-of-flt with the additional a priori information represented as the χ2 type value, (Δρ/σρ)2. These maps are used to derive the best-fitting atmospheric pressure p0 at the reference radius r0 of 1215 km and the cross-track correction Δρ to the ephemerides, of which the a priori uncertainty σρ is 72 km. The surface pressure psurf and the geocentric closest approach distance ρcag to the shadow center are obtained by linear transformations of Δρ and p0, respectively. The best-fitting ![]() and
and ![]() values per degree of freedom are 1.160 and 1.155, respectively.
values per degree of freedom are 1.160 and 1.155, respectively.
Current usage metrics show cumulative count of Article Views (full-text article views including HTML views, PDF and ePub downloads, according to the available data) and Abstracts Views on Vision4Press platform.
Data correspond to usage on the plateform after 2015. The current usage metrics is available 48-96 hours after online publication and is updated daily on week days.
Initial download of the metrics may take a while.