Fig. 8.
Download original image
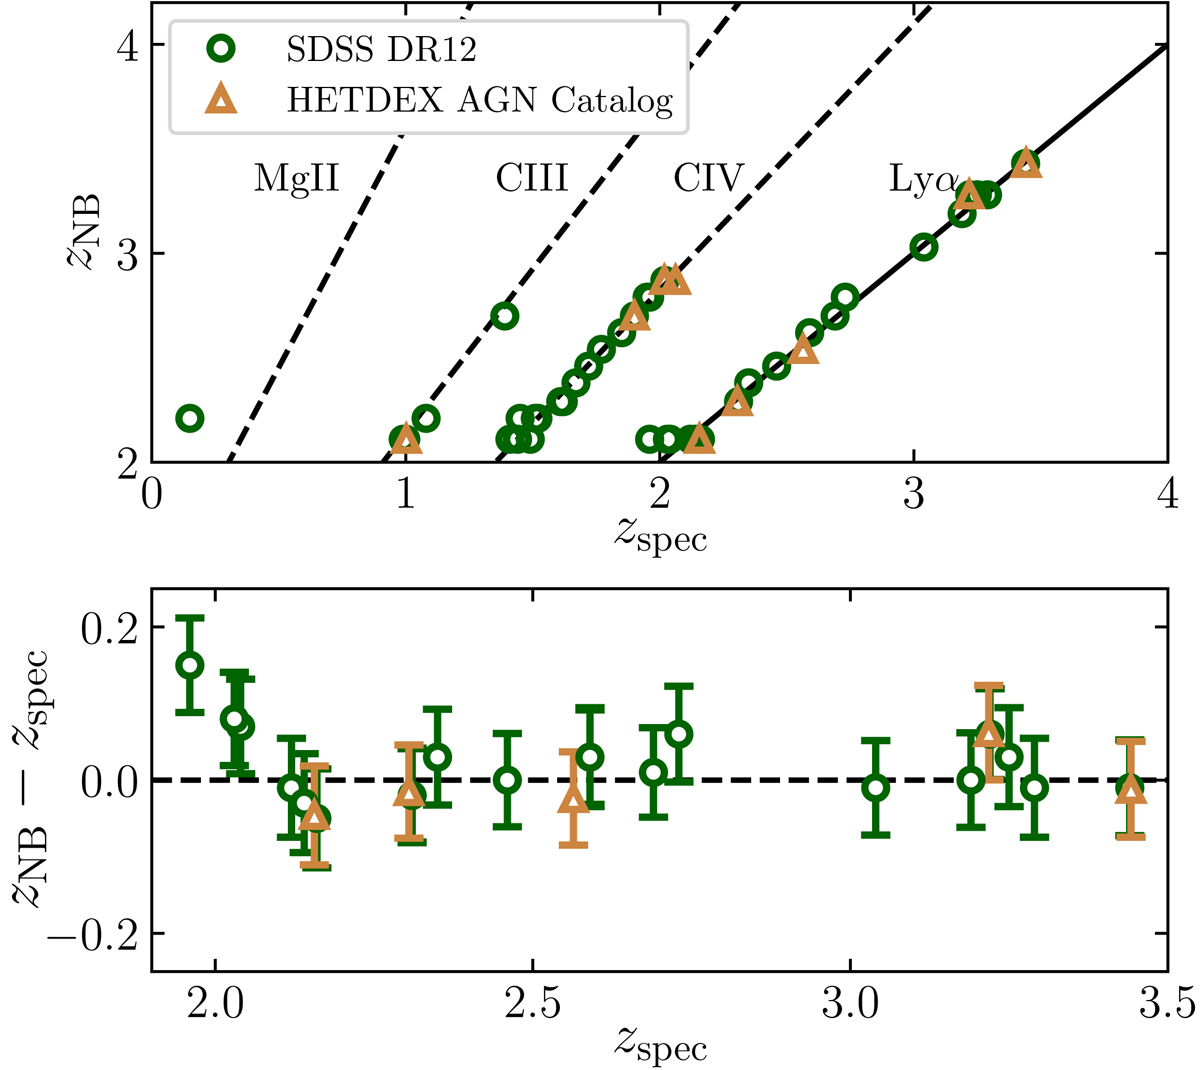
Comparison between the NB and spectroscopic redshifts of the candidates. Top: retrieved Lyα redshift of the candidates with SDSS or HETDEX spectrum. The straight lines represent the redshift at which the most common QSO contaminant lines are selected as Lyα. Bottom: difference between the NB Lyα redshift of the good candidates and the spectroscopic redshifts given by SDSS or HETDEX. The error bars show the redshift interval covered by the width of the NB in which the candidate is selected.
Current usage metrics show cumulative count of Article Views (full-text article views including HTML views, PDF and ePub downloads, according to the available data) and Abstracts Views on Vision4Press platform.
Data correspond to usage on the plateform after 2015. The current usage metrics is available 48-96 hours after online publication and is updated daily on week days.
Initial download of the metrics may take a while.