Fig. 6.
Download original image
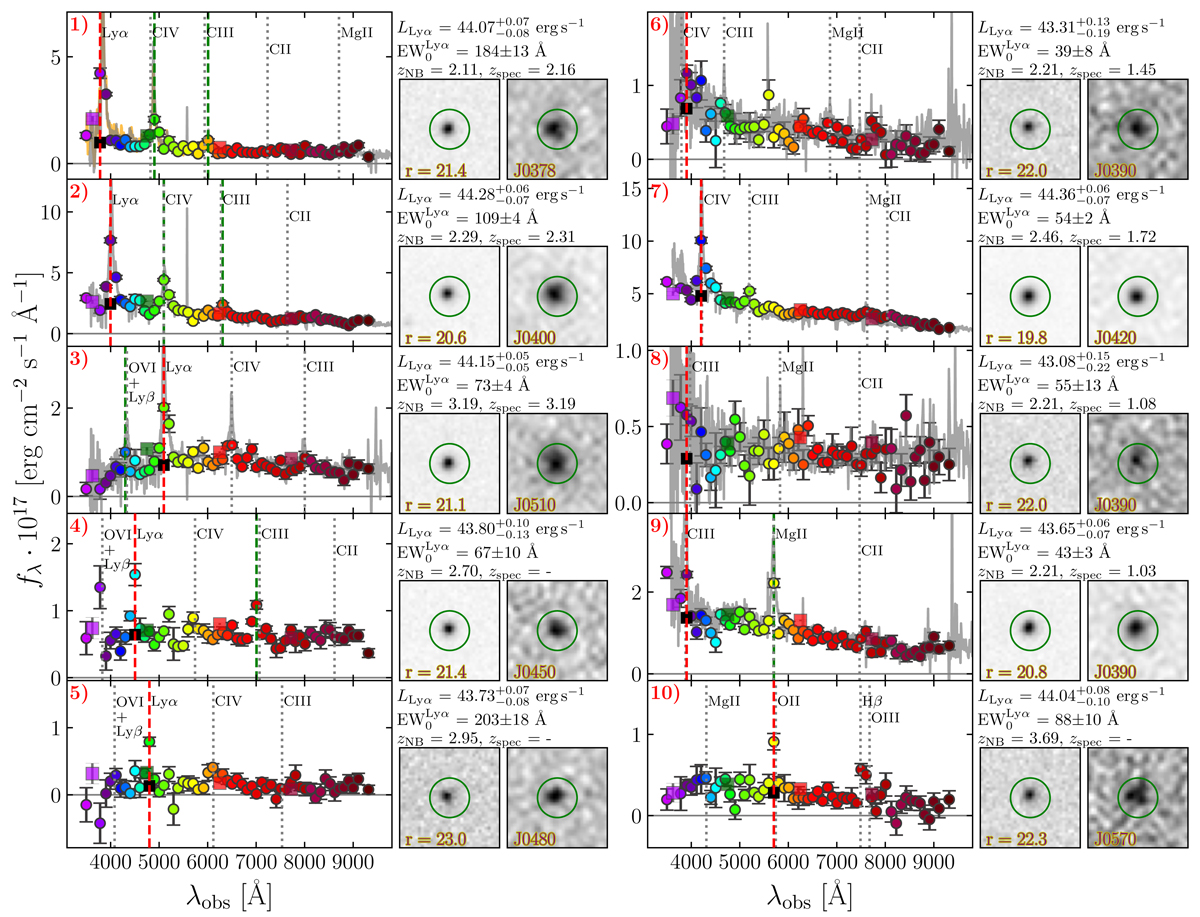
Examples of miniJPAS and J-NEP LAE candidates. We show the fluxes of the 56 narrow medium (colored circles) and broad bands (colored squares) of the J-PAS filter set. The NB selected as Lyα by our pipeline is marked with a red dashed line. The detected secondary QSO lines are marked with green dashed lines (see Sect. 4.1.3). Spectroscopically or visually identified emission lines of the objects are shown with a gray dotted line. We also show the images of each source in r and the selected NB. The spectra of the SDSS DR16 (HETDEX) counterparts are shown in gray (orange) when available. The five objects in the left column are examples of LAEs identified by our method. The right column show five examples of possible contaminants.
Current usage metrics show cumulative count of Article Views (full-text article views including HTML views, PDF and ePub downloads, according to the available data) and Abstracts Views on Vision4Press platform.
Data correspond to usage on the plateform after 2015. The current usage metrics is available 48-96 hours after online publication and is updated daily on week days.
Initial download of the metrics may take a while.