Fig. 4.
Download original image
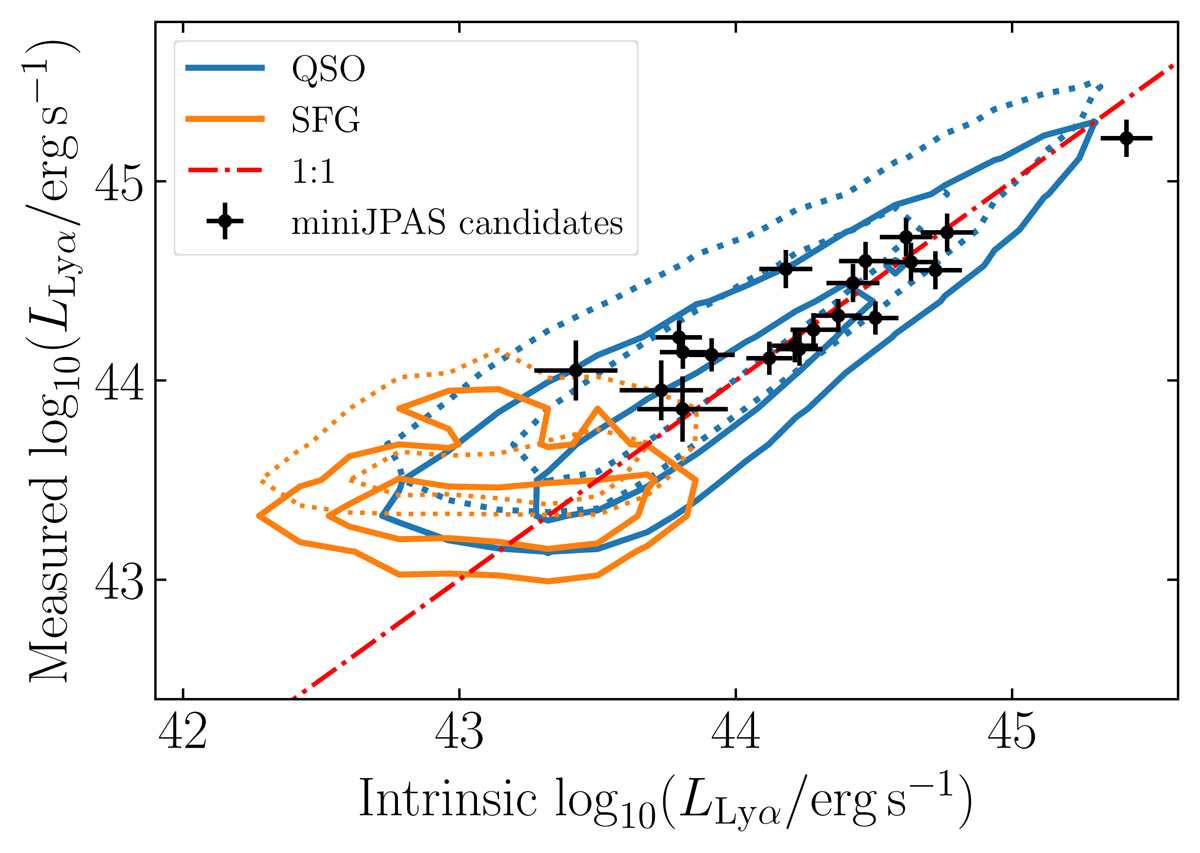
Contours showing the areas encompassing the 68% and 95% of the LAEs in the mock showing the retrieved (observed) Lyα luminosity as a function of the real value in the catalog. The dotted and solid line contours show the values of LLyα before and after applying the bias subtraction, respectively (see Sect. 4.2). Black dots represent the observational candidates from miniJPAS with a spectroscopic counterpart (see Sect. 4.8).
Current usage metrics show cumulative count of Article Views (full-text article views including HTML views, PDF and ePub downloads, according to the available data) and Abstracts Views on Vision4Press platform.
Data correspond to usage on the plateform after 2015. The current usage metrics is available 48-96 hours after online publication and is updated daily on week days.
Initial download of the metrics may take a while.