Fig. 2.
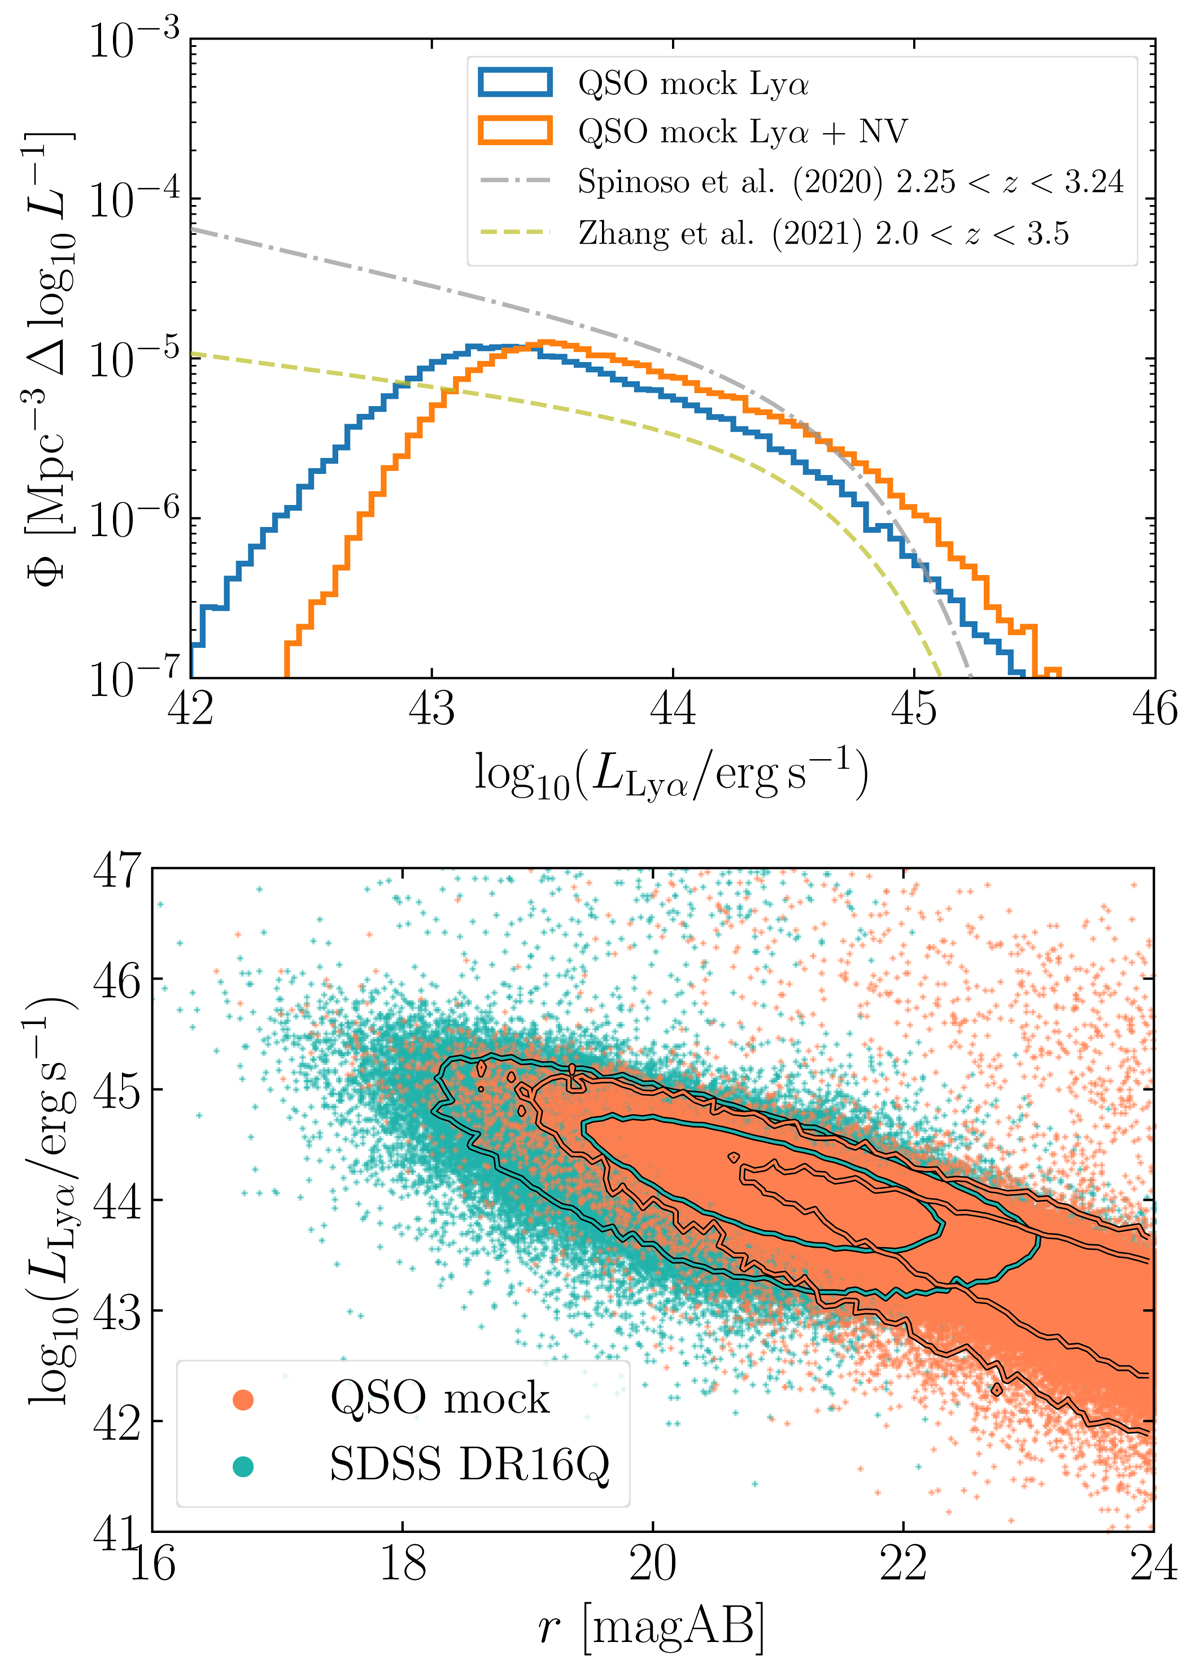
Download original image
Basic properties of the QSO mock. Top: output Lyα LF of the QSO mock at z > 2. The measurement of the Lyα line can often be affected by the presence of the N V line, for this reason we also show the Lyα+N V LF. The bias correction in the LLyα measurement caused by N V is addressed in Sect. 4.2. We compare with the fits for the QSO Lyα LF in Spinoso et al. (2020) and Zhang et al. (2021), using a Schechter and a double power-law, respectively. Bottom: LLyα as a function of r magnitude for the sources in the QSO mock (orange) and the QSOs of SDSS DR16Q with a LLyαS/N > 5 (blue). The contour lines mark the regions containing the 68% and 95% of the objects.
Current usage metrics show cumulative count of Article Views (full-text article views including HTML views, PDF and ePub downloads, according to the available data) and Abstracts Views on Vision4Press platform.
Data correspond to usage on the plateform after 2015. The current usage metrics is available 48-96 hours after online publication and is updated daily on week days.
Initial download of the metrics may take a while.