Fig. C.1.
Download original image
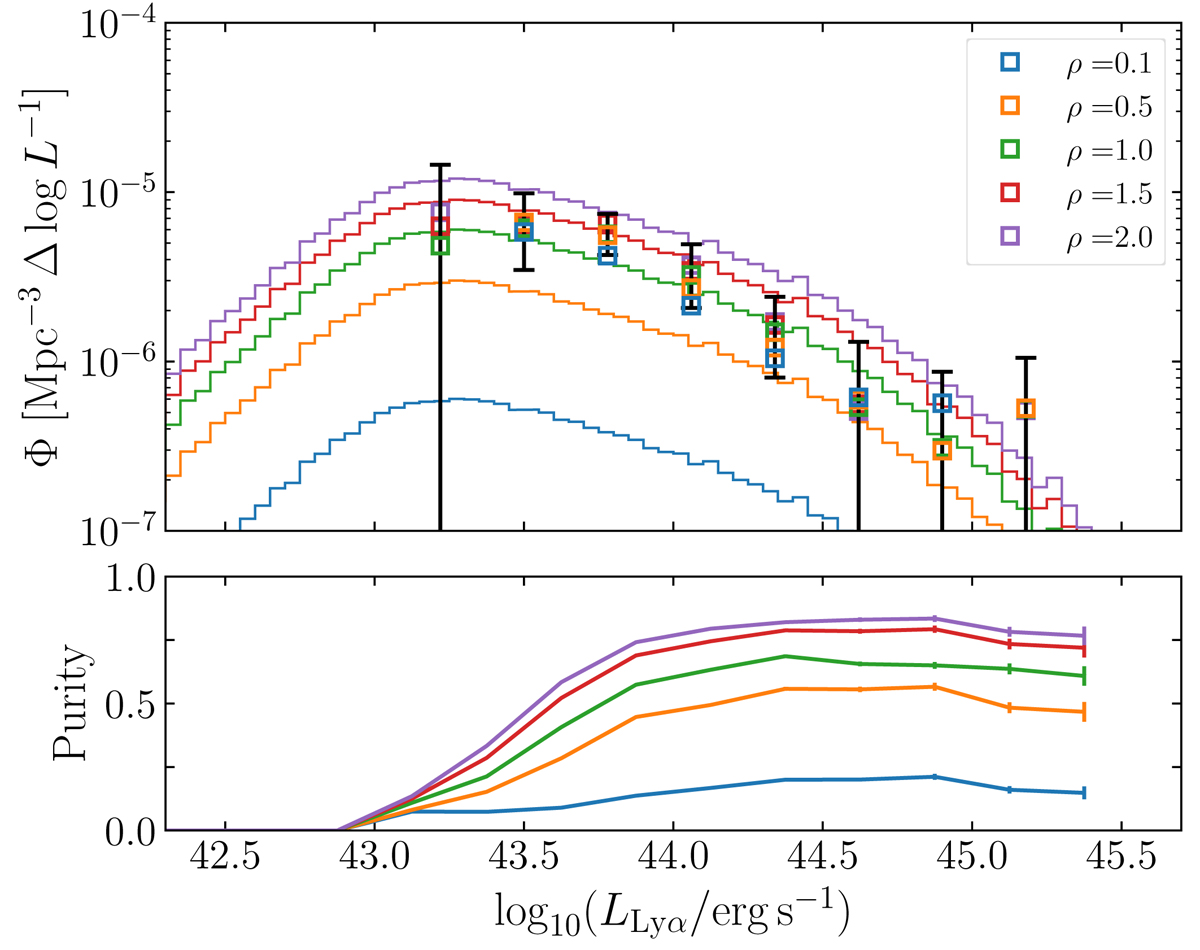
Effects of varying the sample purity on the estimated Lyα LF. Top: Colored squares show different realizations of our Lyα LF in the range z = 2.0 − 3.8, obtained after scaling the number of true positives in the purity computation by a factor ρ = 0.1, 0.5, 1.0, 1.5, 2.0. We also show the mock QSO LF for each ρ (solid lines). We show the uncertainties of the LF with ρ = 1. The variation of the LF is inside the 1σ errors for all the shown values of ρ. Bottom: Estimated purity for the different values of ρ.
Current usage metrics show cumulative count of Article Views (full-text article views including HTML views, PDF and ePub downloads, according to the available data) and Abstracts Views on Vision4Press platform.
Data correspond to usage on the plateform after 2015. The current usage metrics is available 48-96 hours after online publication and is updated daily on week days.
Initial download of the metrics may take a while.