Fig. B.1.
Download original image
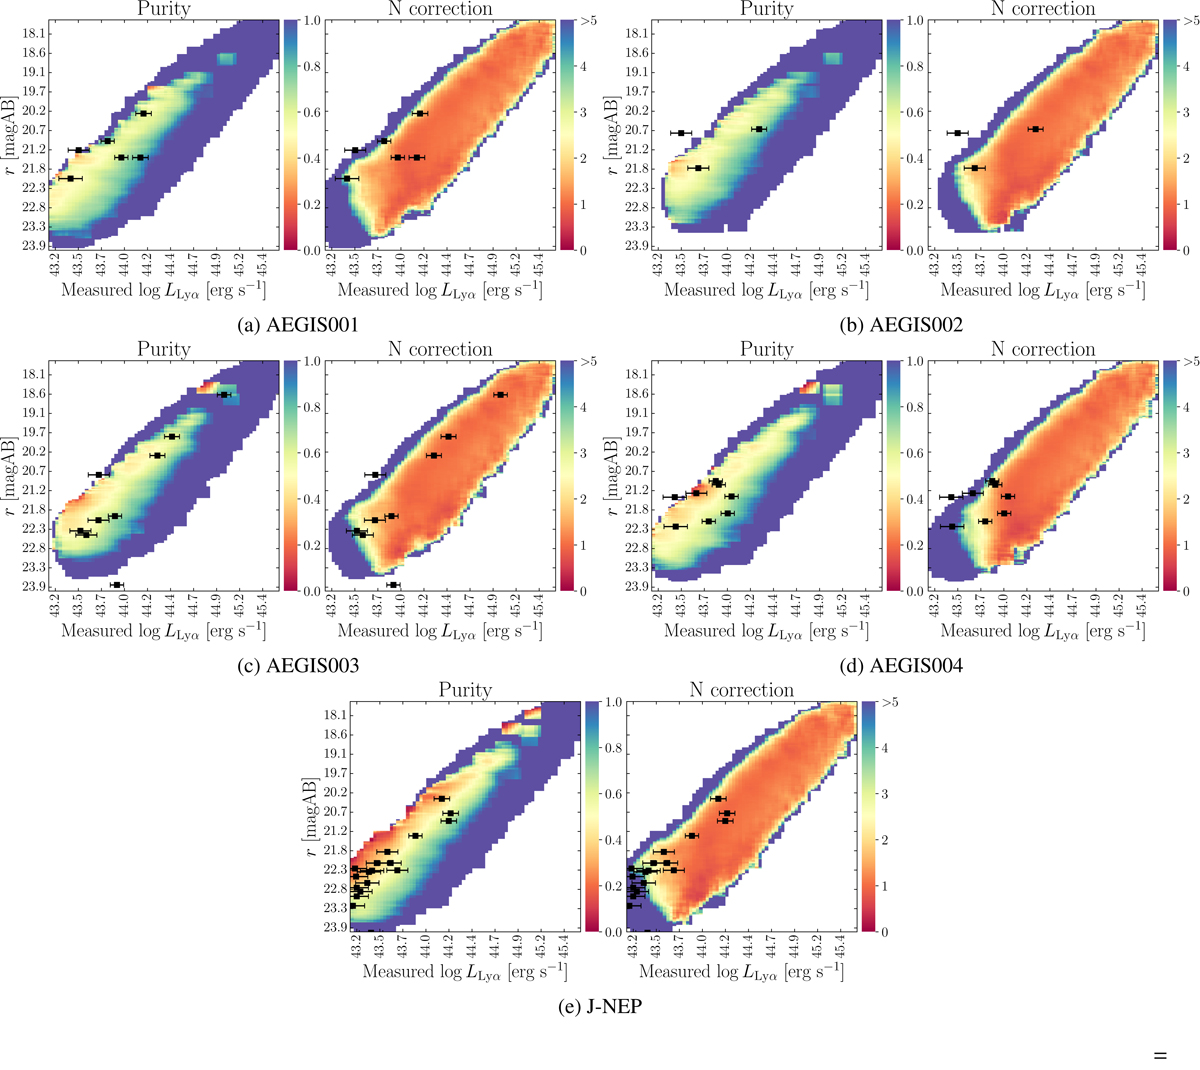
2D maps of the purity and number count correction for the four miniJPAS fields and J-NEP in the redshift interval z = 2.3–2.8. The maps are computed for every field in miniJPAS and J-NEP and every interval of redshift used in this work, only one z interval is shown for brevity. The black squares and error bars represent the LAE candidates of each field in the chosen interval of redshift.
Current usage metrics show cumulative count of Article Views (full-text article views including HTML views, PDF and ePub downloads, according to the available data) and Abstracts Views on Vision4Press platform.
Data correspond to usage on the plateform after 2015. The current usage metrics is available 48-96 hours after online publication and is updated daily on week days.
Initial download of the metrics may take a while.